Our monthly Market Report provides meaningful and valuable information, to empower buyers and sellers who are considering a real estate transaction in Nassau or Paradise Island (Bahamas).
If you're considering selling your property or buying property on Nassau or Paradise Island, it's essential to understand what's happening in The Bahamas' real estate market. Knowing the most important data, such as median and average prices, the number of properties sold, the number of new listings, and the days on the market will better prepare you for selling or buying.
We are happy to share our October 2023 analysis of the Nassau and Paradise Island market. We also encourage you to review our quarterly market reports on Abaco, Eleuthera, Exuma, Grand Bahama and New Providence.
Our market reports provide Morley's interpretation of the data from the Bahamas Real Estate Association MLS. Even though the MLS does not include all real estate sales and related real estate data, we believe the MLS data is reasonable and consistent to be reliable to use to estimate local real estate trends.

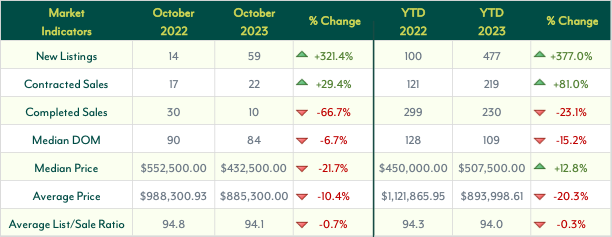
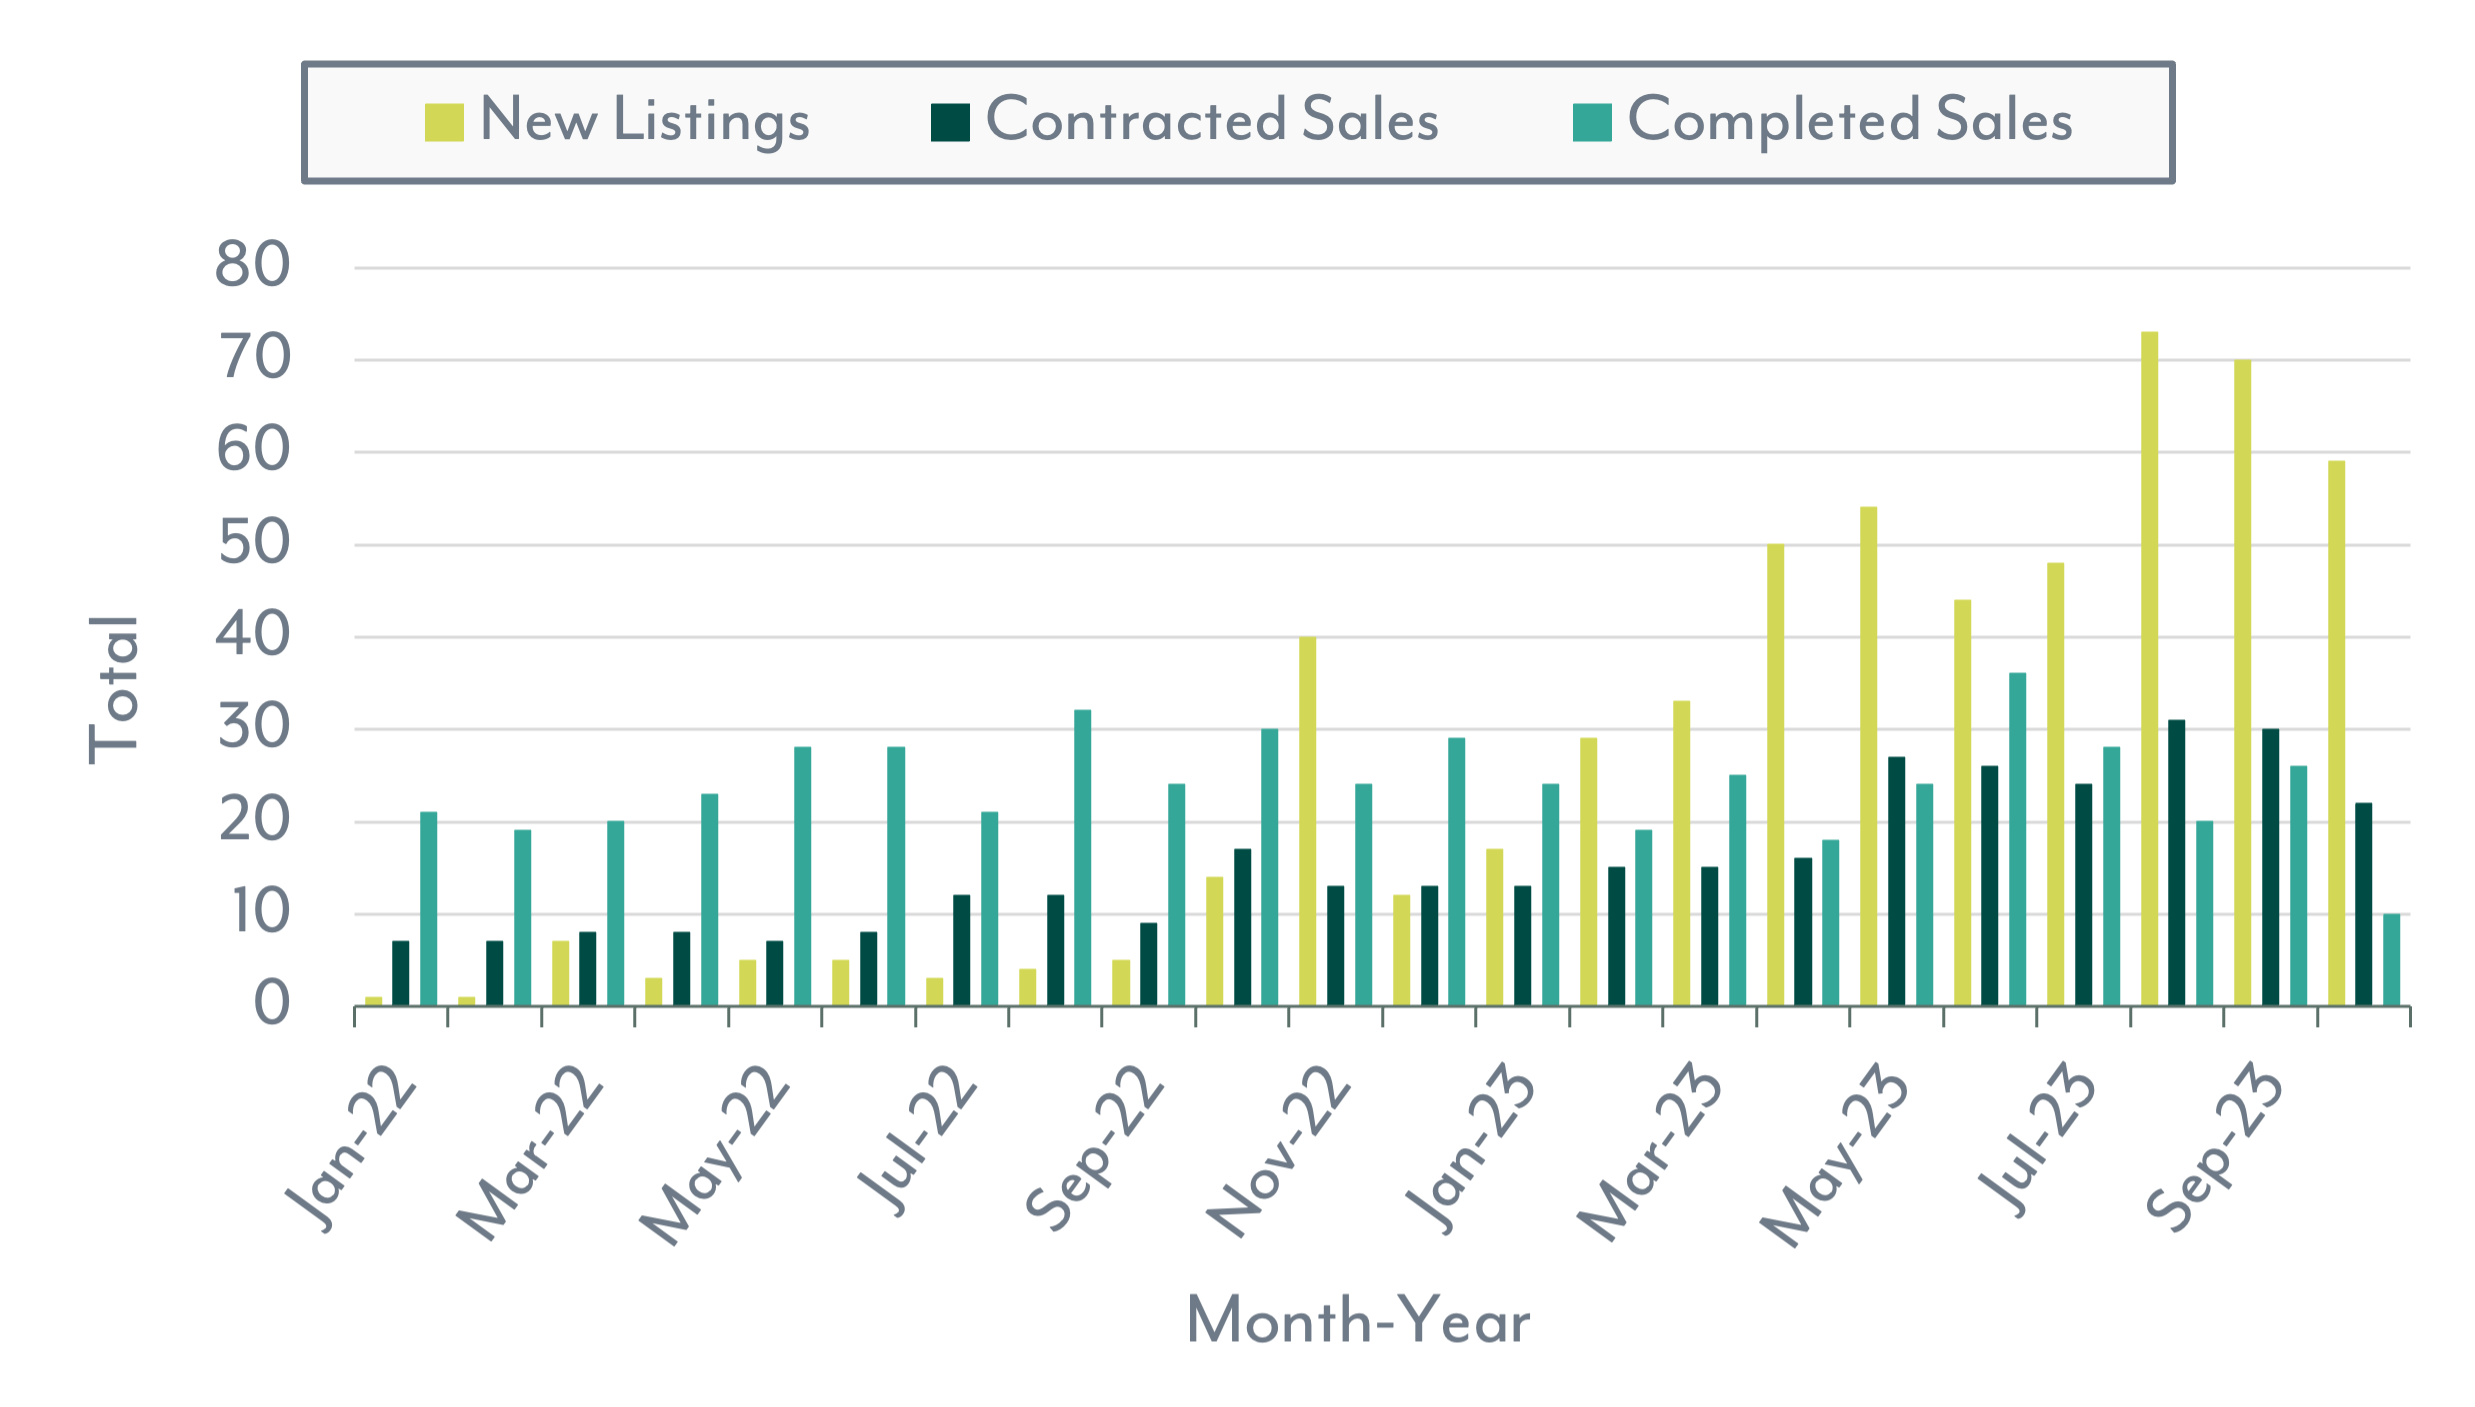
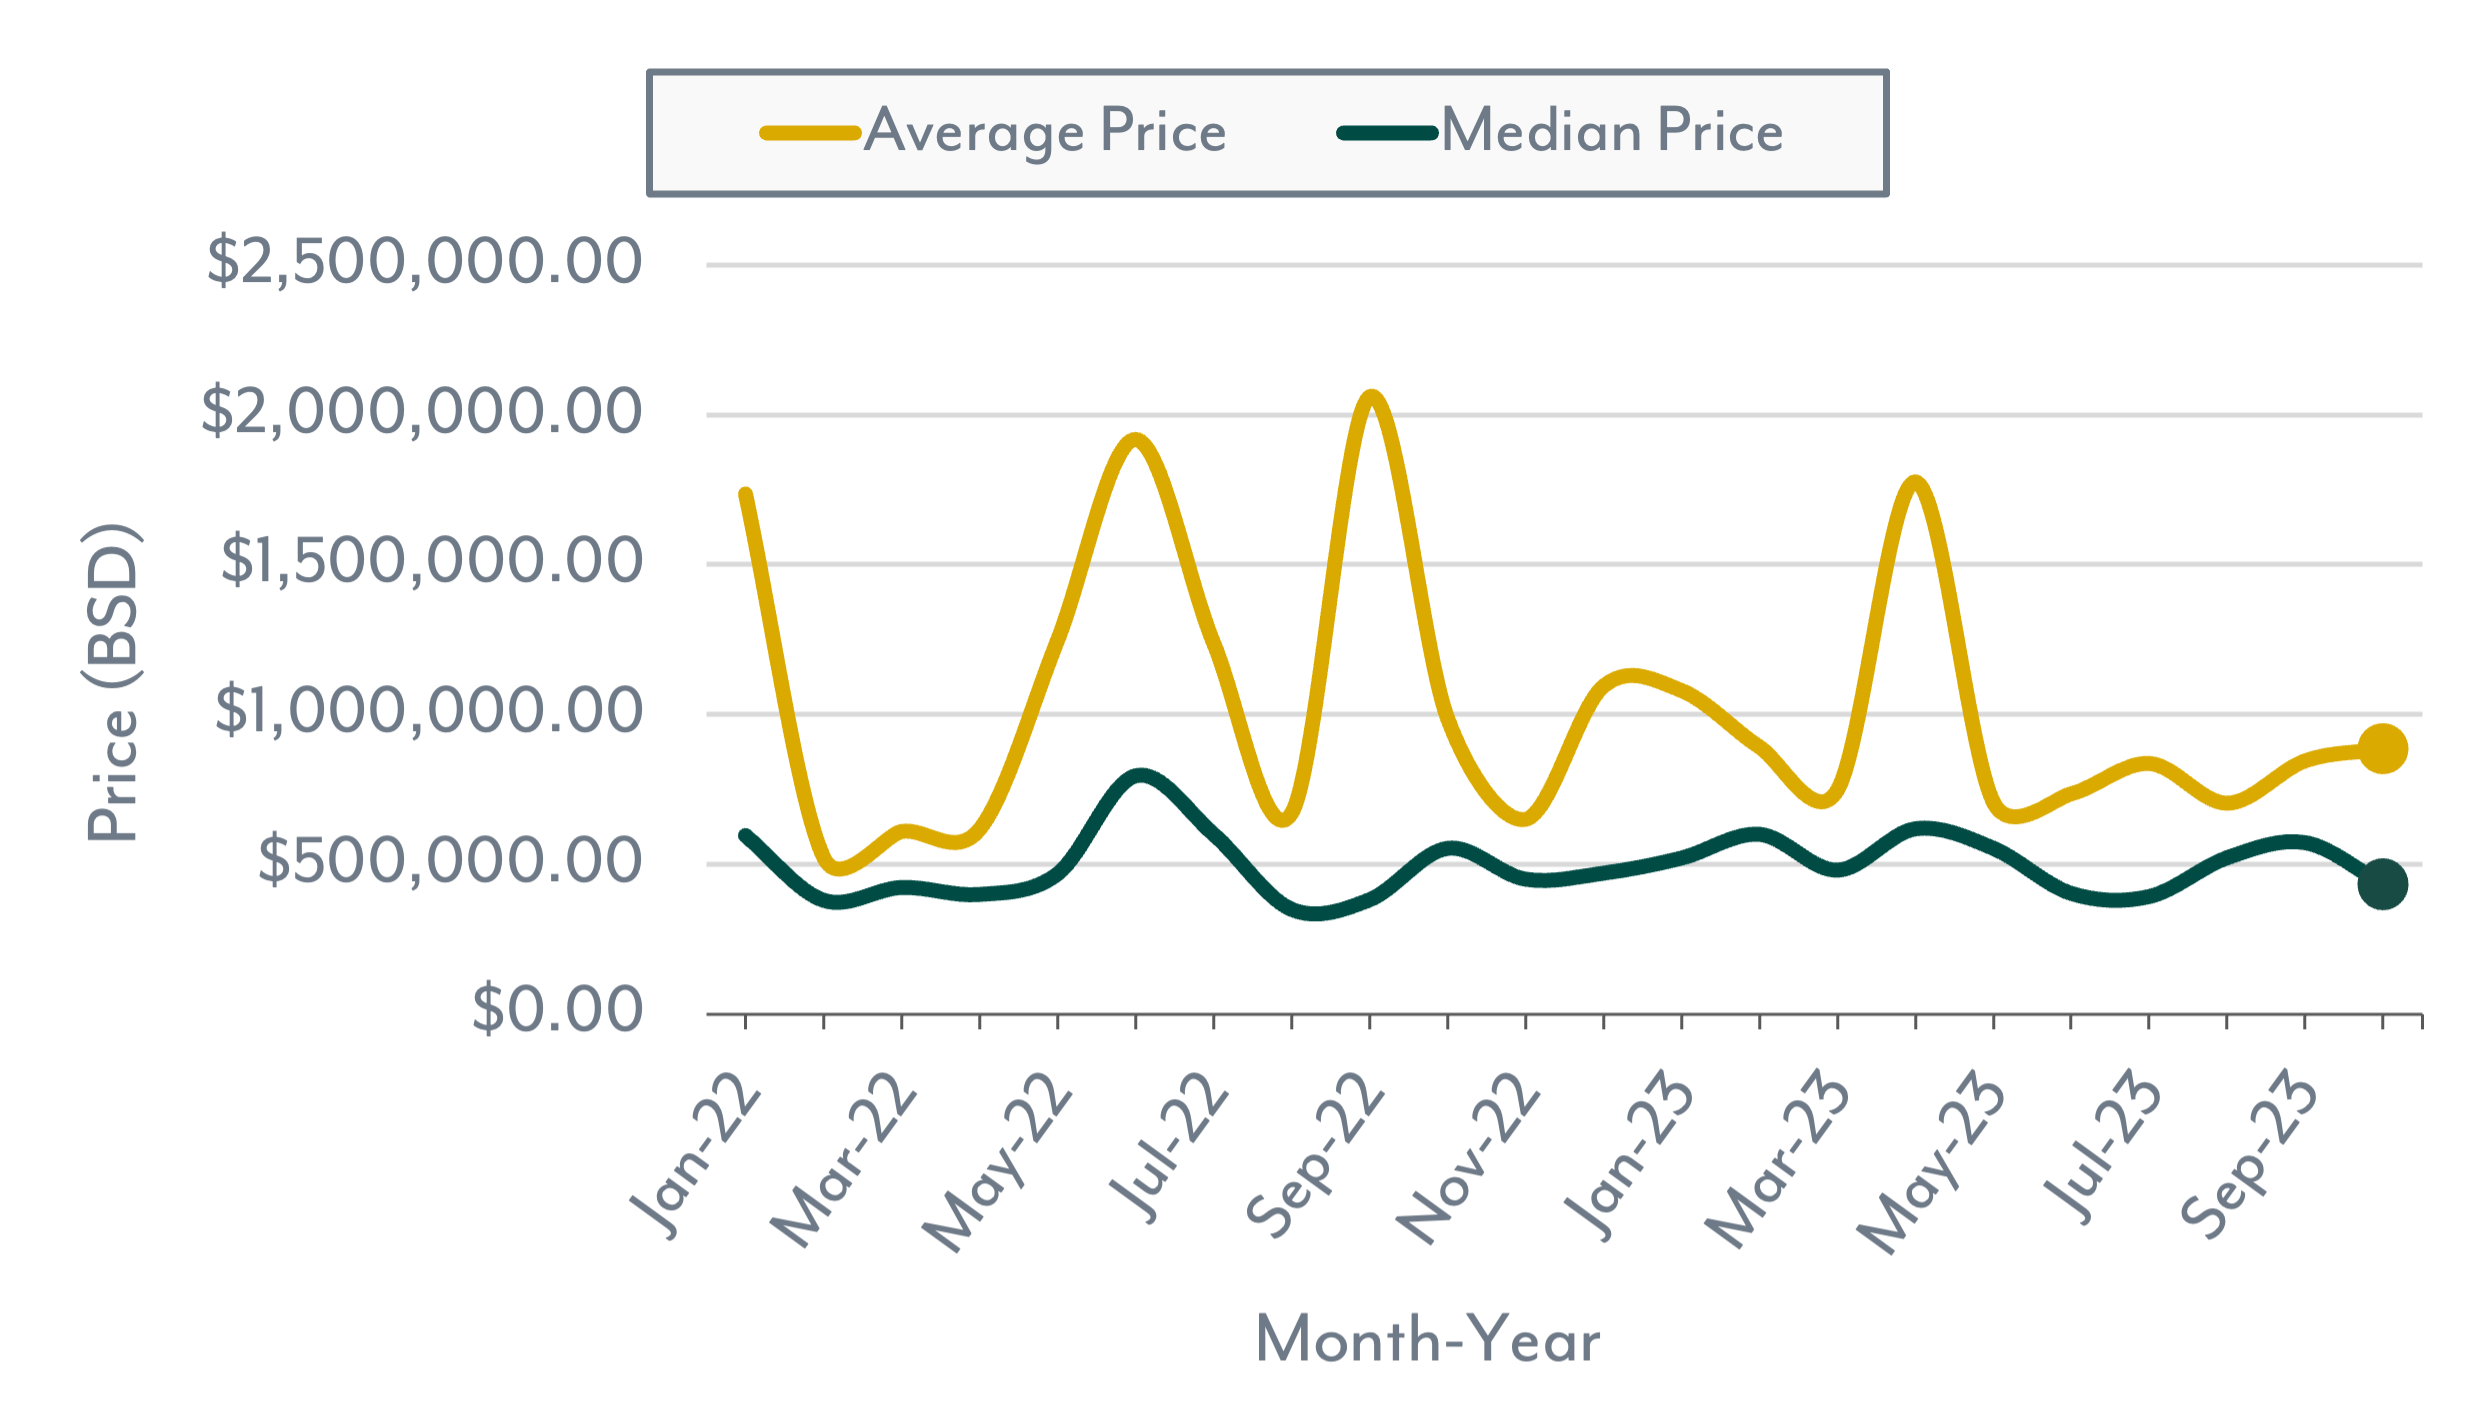
The volume of contracted home sales for October (22) reduced from August (31) and September (30) volumes but the volume was still 29.4% higher than the October 2022 volume of contracted home sales. The median sales price decreased from last month, 21.7% less than October 2022, but the YTD median price is 12.8% higher than the 2022 YTD median price. The average sales price for October continued to increase since May but was 10.4% lower than October 2022 while the 2023 YTD average price is 20.3% lower than the 2022 YTD average price. The volume of closed home sales for October (10) dropped 66.7% versus October 2022 and was the lowest volume for 2023. The number of new home listings for October (59) is the third-highest monthly volume in all of 2023 and increased 321.4% over the October 2022 volume of new listings. Since February 2023, the number of new home listings continues to far exceed the number of contracted sales each month, thereby continuing to increase the inventory of Nassau and Paradise Island homes currently on the market. The "Days on the Market" for October contracted home sales (84) decreased over the last two months and decreased 15.2% YTD versus 2022 YTD. The Average List/Sale Ratio for October 2023 decreased slightly from last month and from October 2022, while the 2023 YTD decreased slightly (0.3% ) from the 2022 YTD.
Home Market Indicators
New Listings, Contracted Sales & Completed Sales
Average & Median Price

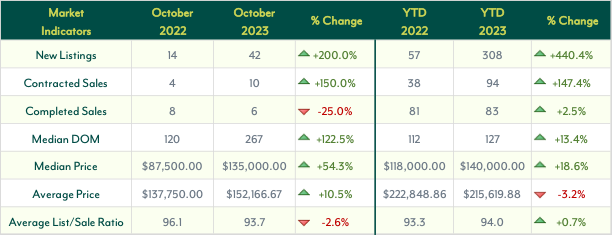
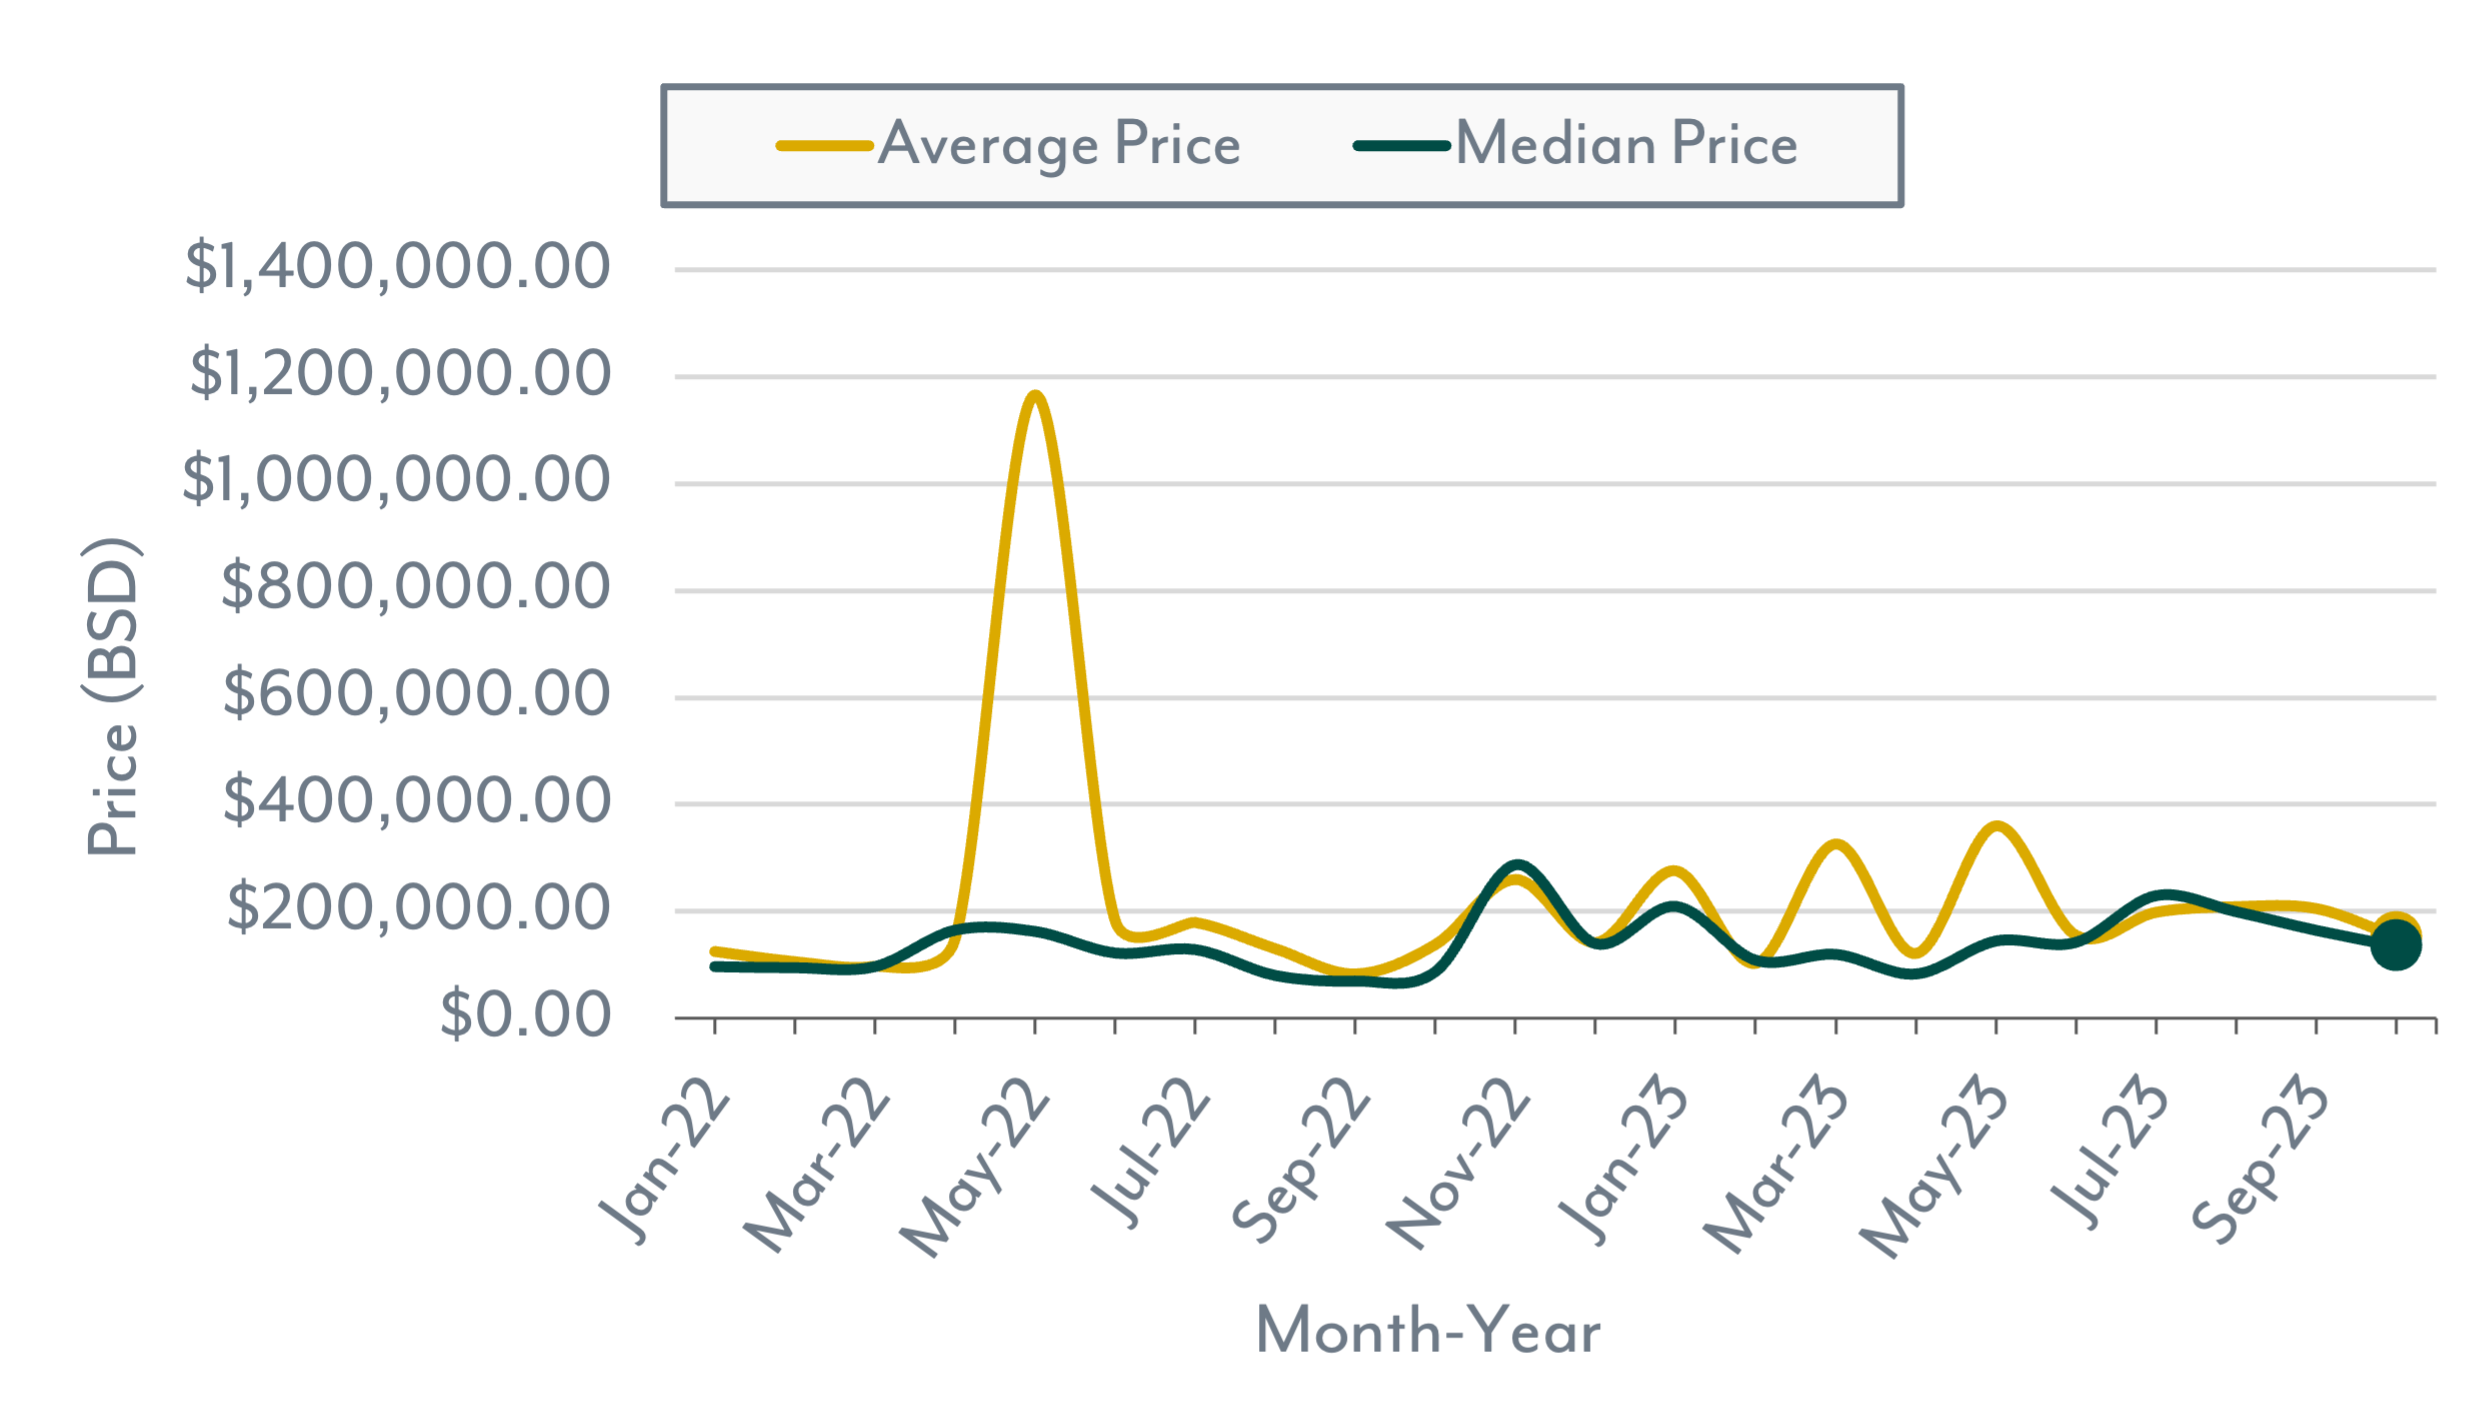
The volume of contracted land sales for October (10) is lower than September but increased 150% over the October 2022 volume. The median sales price was lower than in the last 3 months but 54.3% higher than October 2022 and the 2023 YTD is 18.6% higher than the 2022 YTD median price. The average sales price for October shows a decrease over last month, a 10.5% increase over the October 2022 average price while the 2023 YTD average price is 3.2% lower than the 2022 YTD average price. The volume of closed land sales for October dropped from the previous month and was 25% less than the October 2022 volume, but the 2023 YTD volume of completed sales increased 2.5% over the 2022 YTD completed sales. The volume of new land listings for October (42) is the third-highest monthly total for 2023 and 200% higher than October 2022 (14). Since the start of 2023, each month, the volume of new land listings has exceeded the contracted sales volume, thereby increasing the inventory of available Nassau and Paradise Island land listings. There was a 122.5% increase in the "Days on the Market" for contracted land sales in October over October 2022 and the 2023 YTD increased 13.4% over the 2022 YTD Day on the Market.
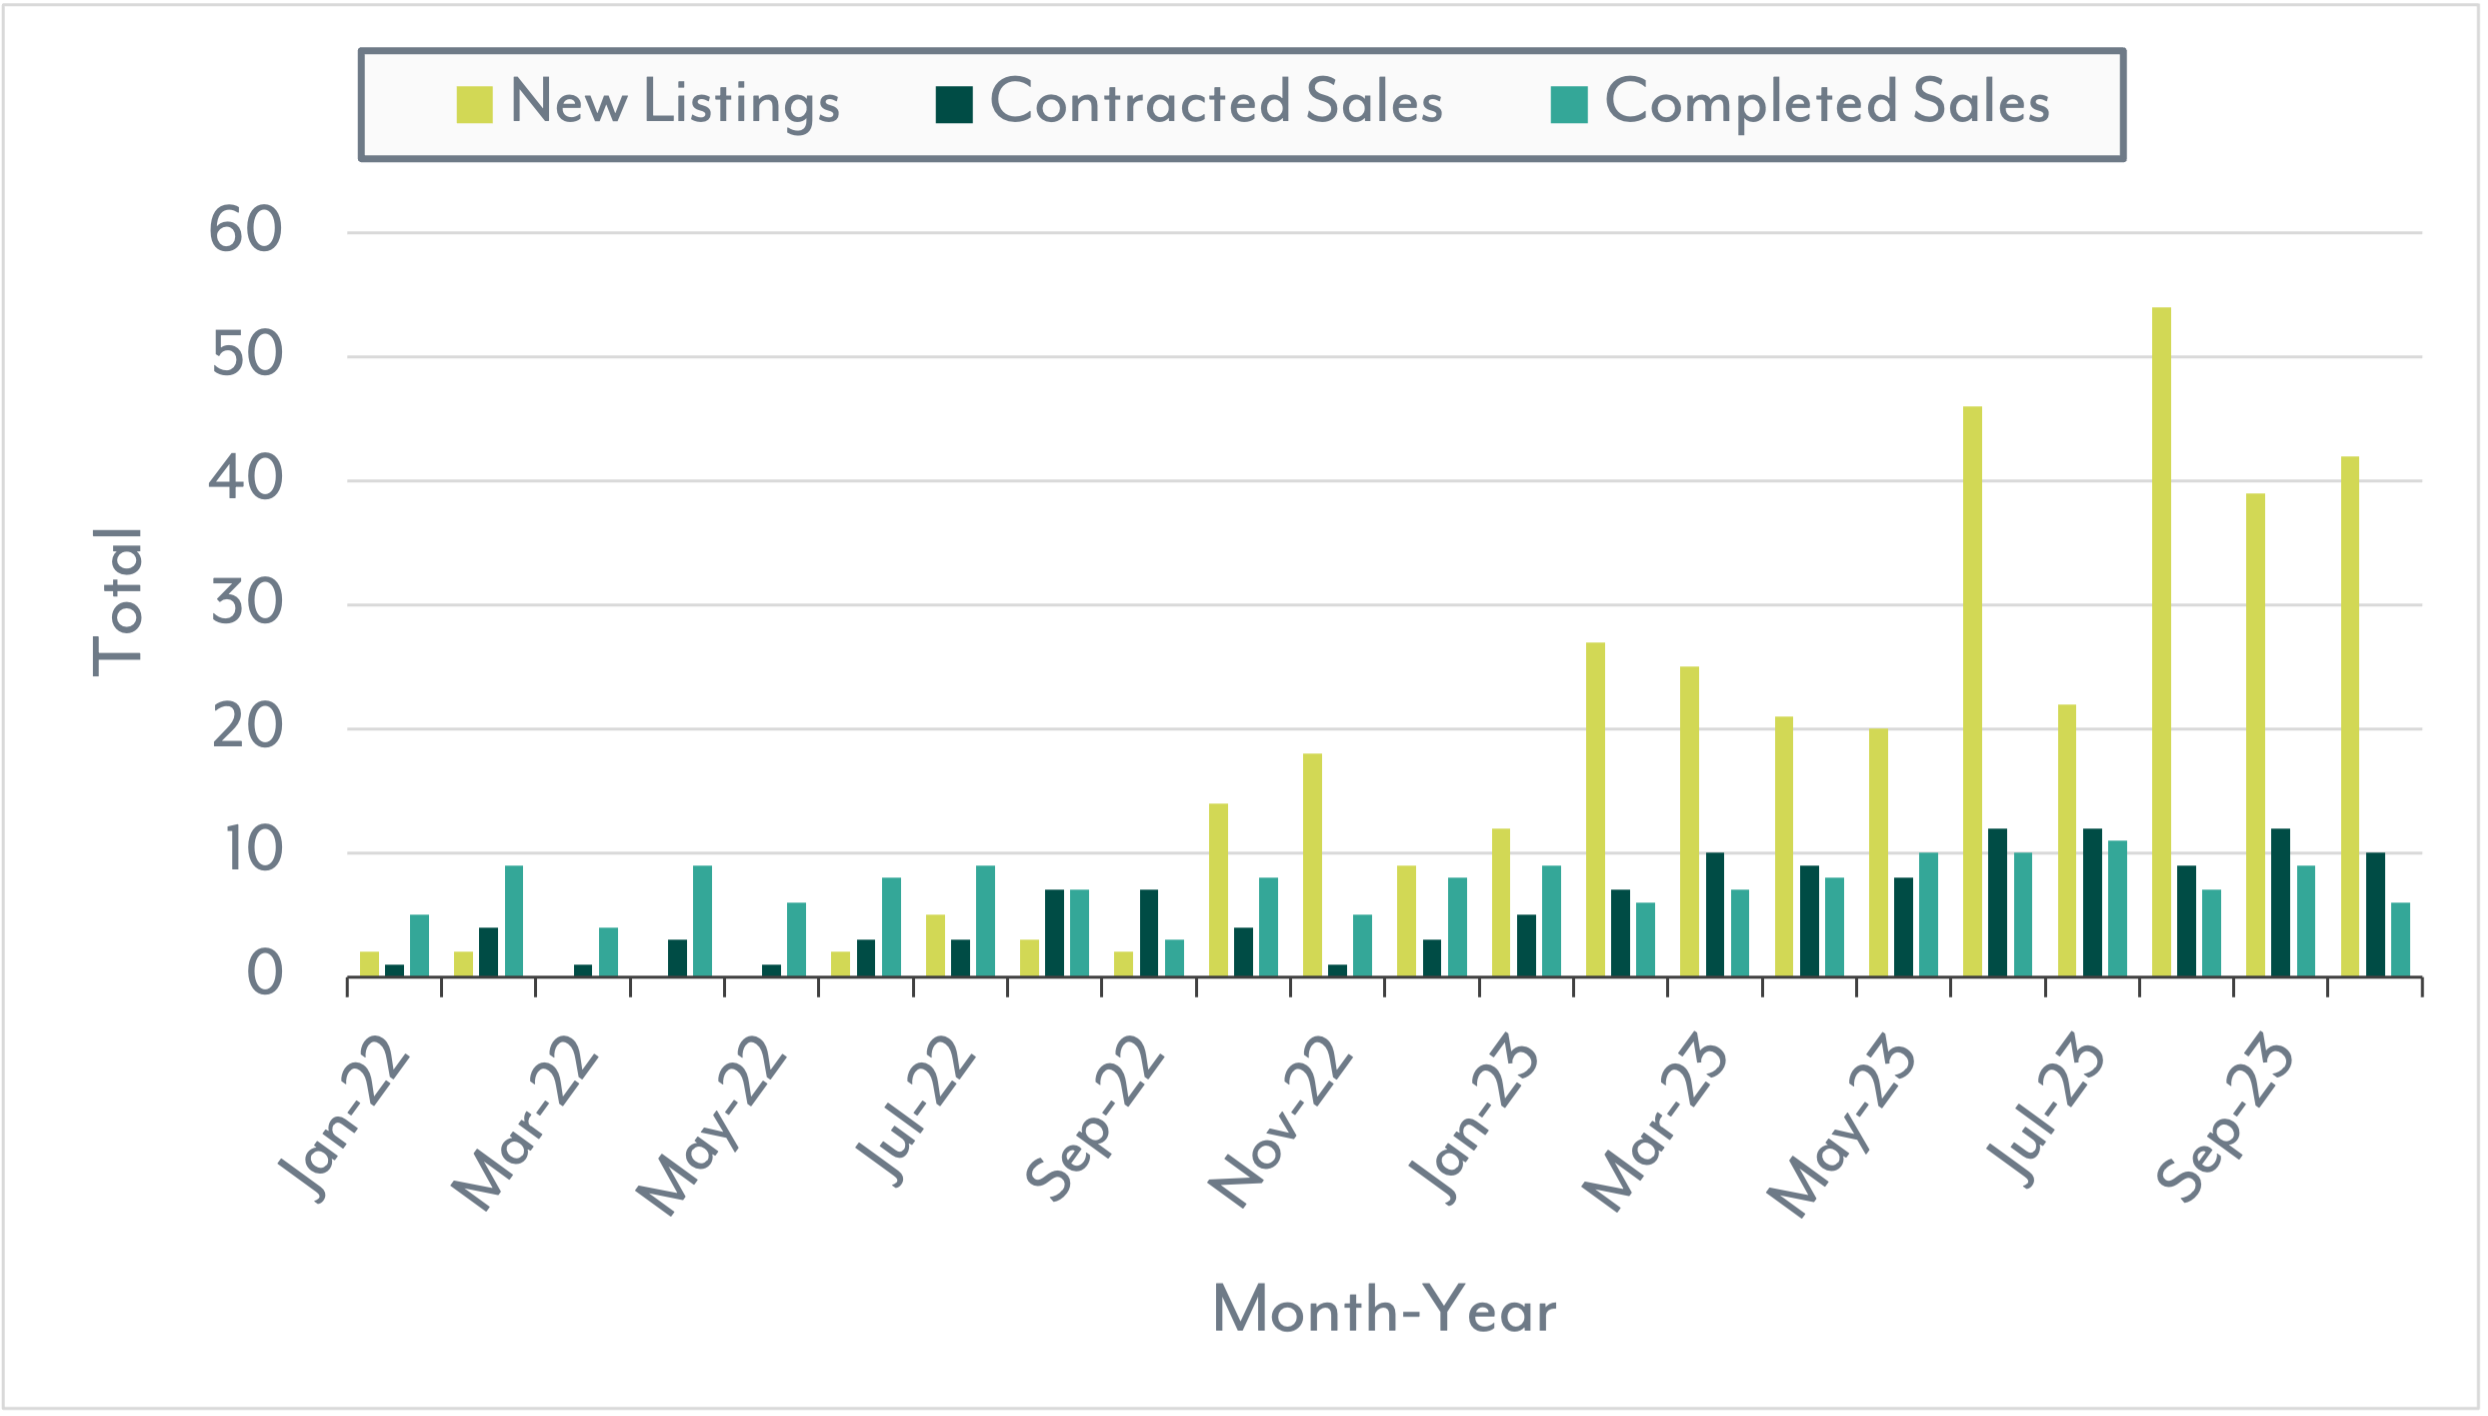
Land Market Indicators
New Listings, Contracted Sales & Completed Sales
Average & Median Price
Curious about whatyour home or property is worth now?
We're able to explain what these numbers mean for you and your home's or property's current market value.