Our monthly Market Report provides meaningful and valuable information, to empower buyers and sellers who are considering a real estate transaction in Nassau or Paradise Island (Bahamas).
If you're considering selling your property or buying property on Nassau or Paradise Island, it's essential to understand what's happening in The Bahamas' real estate market. Knowing the most important data, such as median and average prices, the number of properties sold, the number of new listings, and the days on the market will better prepare you for selling or buying.
We are happy to share our April 2024 analysis of the Nassau and Paradise Island market. We also encourage you to review our quarterly market reports on Abaco, Eleuthera, Exuma, Grand Bahama and New Providence.
Our market reports provide Morley's interpretation of the data from the Bahamas Real Estate Association MLS. Even though the MLS does not include all real estate sales and related real estate data, we believe the MLS data is reasonable and consistent to be reliable to use to estimate local real estate trends.

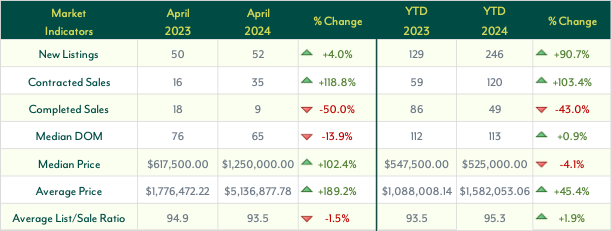
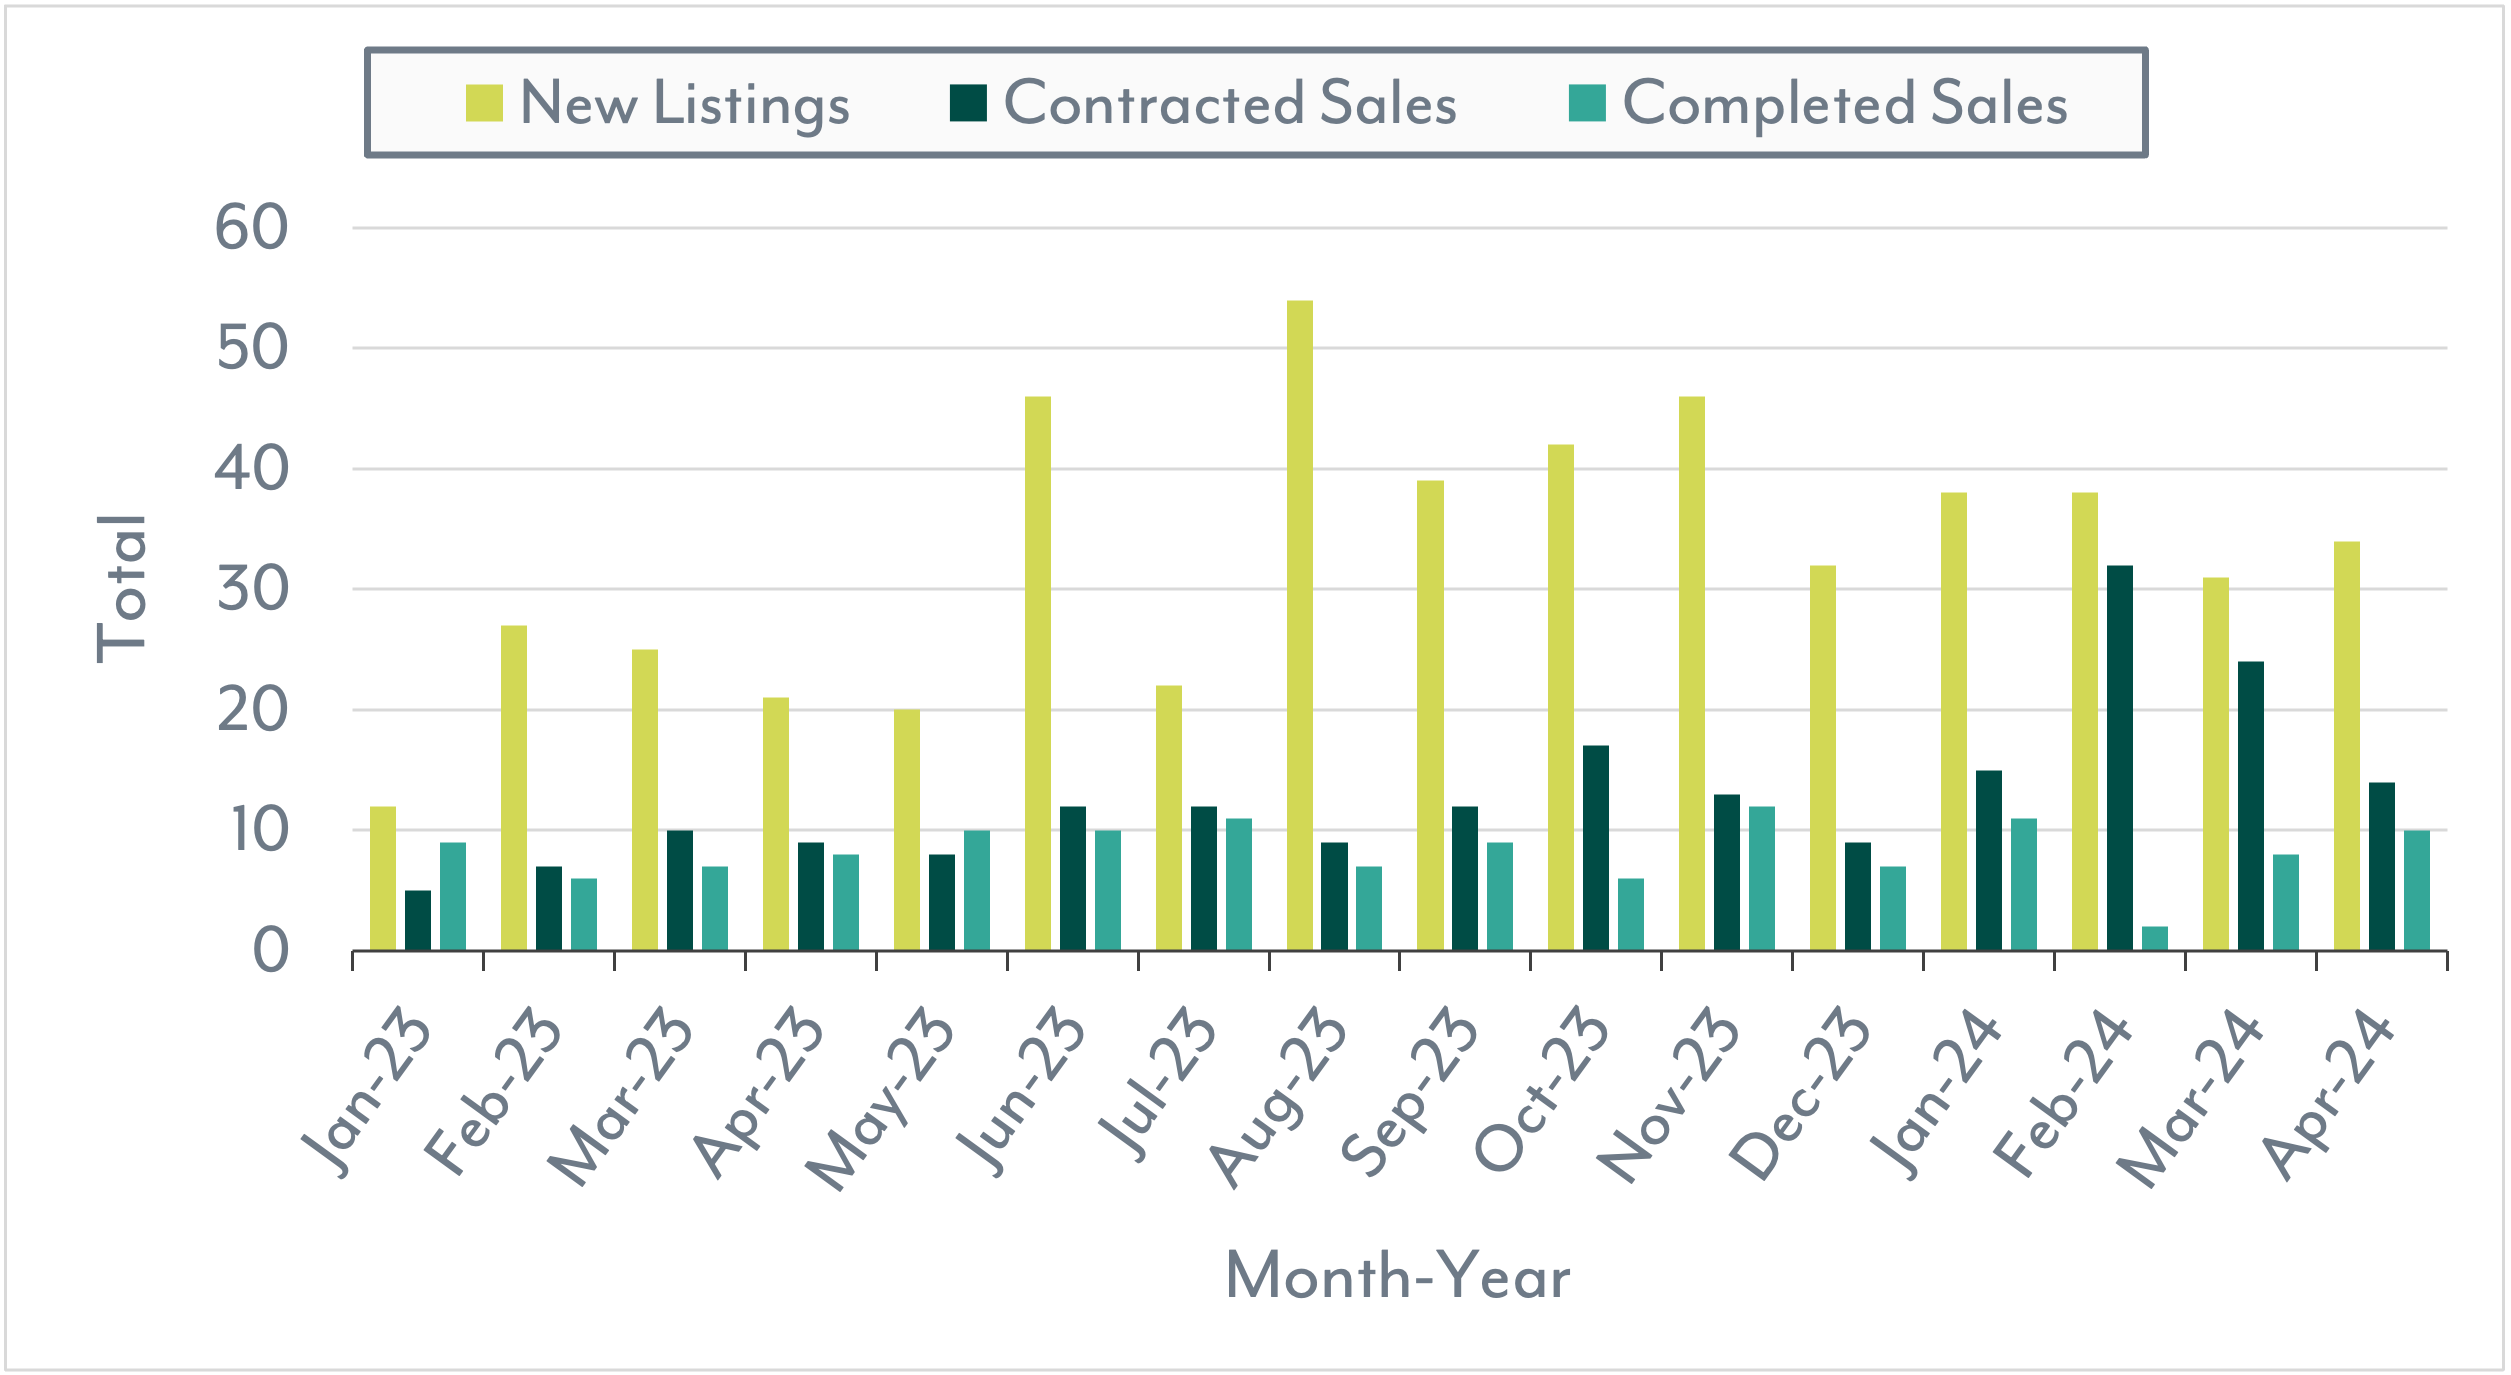
The housing market in Nassau and Paradise Island has been quite consistent over the past year, showing both similarities and differences when comparing 2023 and 2024. While the volume of New Listings has been declining since its peak in February 2024, April 2024 still saw a larger volume compared to the same period in 2023, resulting in a significant increase of 90.7% in New Listings. This increase provides a significant boost in options for buyers.
Moreover, not only have more houses been hitting the market, but there's also been a substantial increase in Contracted Sales of homes, indicating a strong demand with a noteworthy increase of 118.8% compared to April 2023. However, Completed Sales have remained relatively low, showing a contrasting trend with a significant decrease of 50% both in April 2024 and year-to-date, down by 43%.
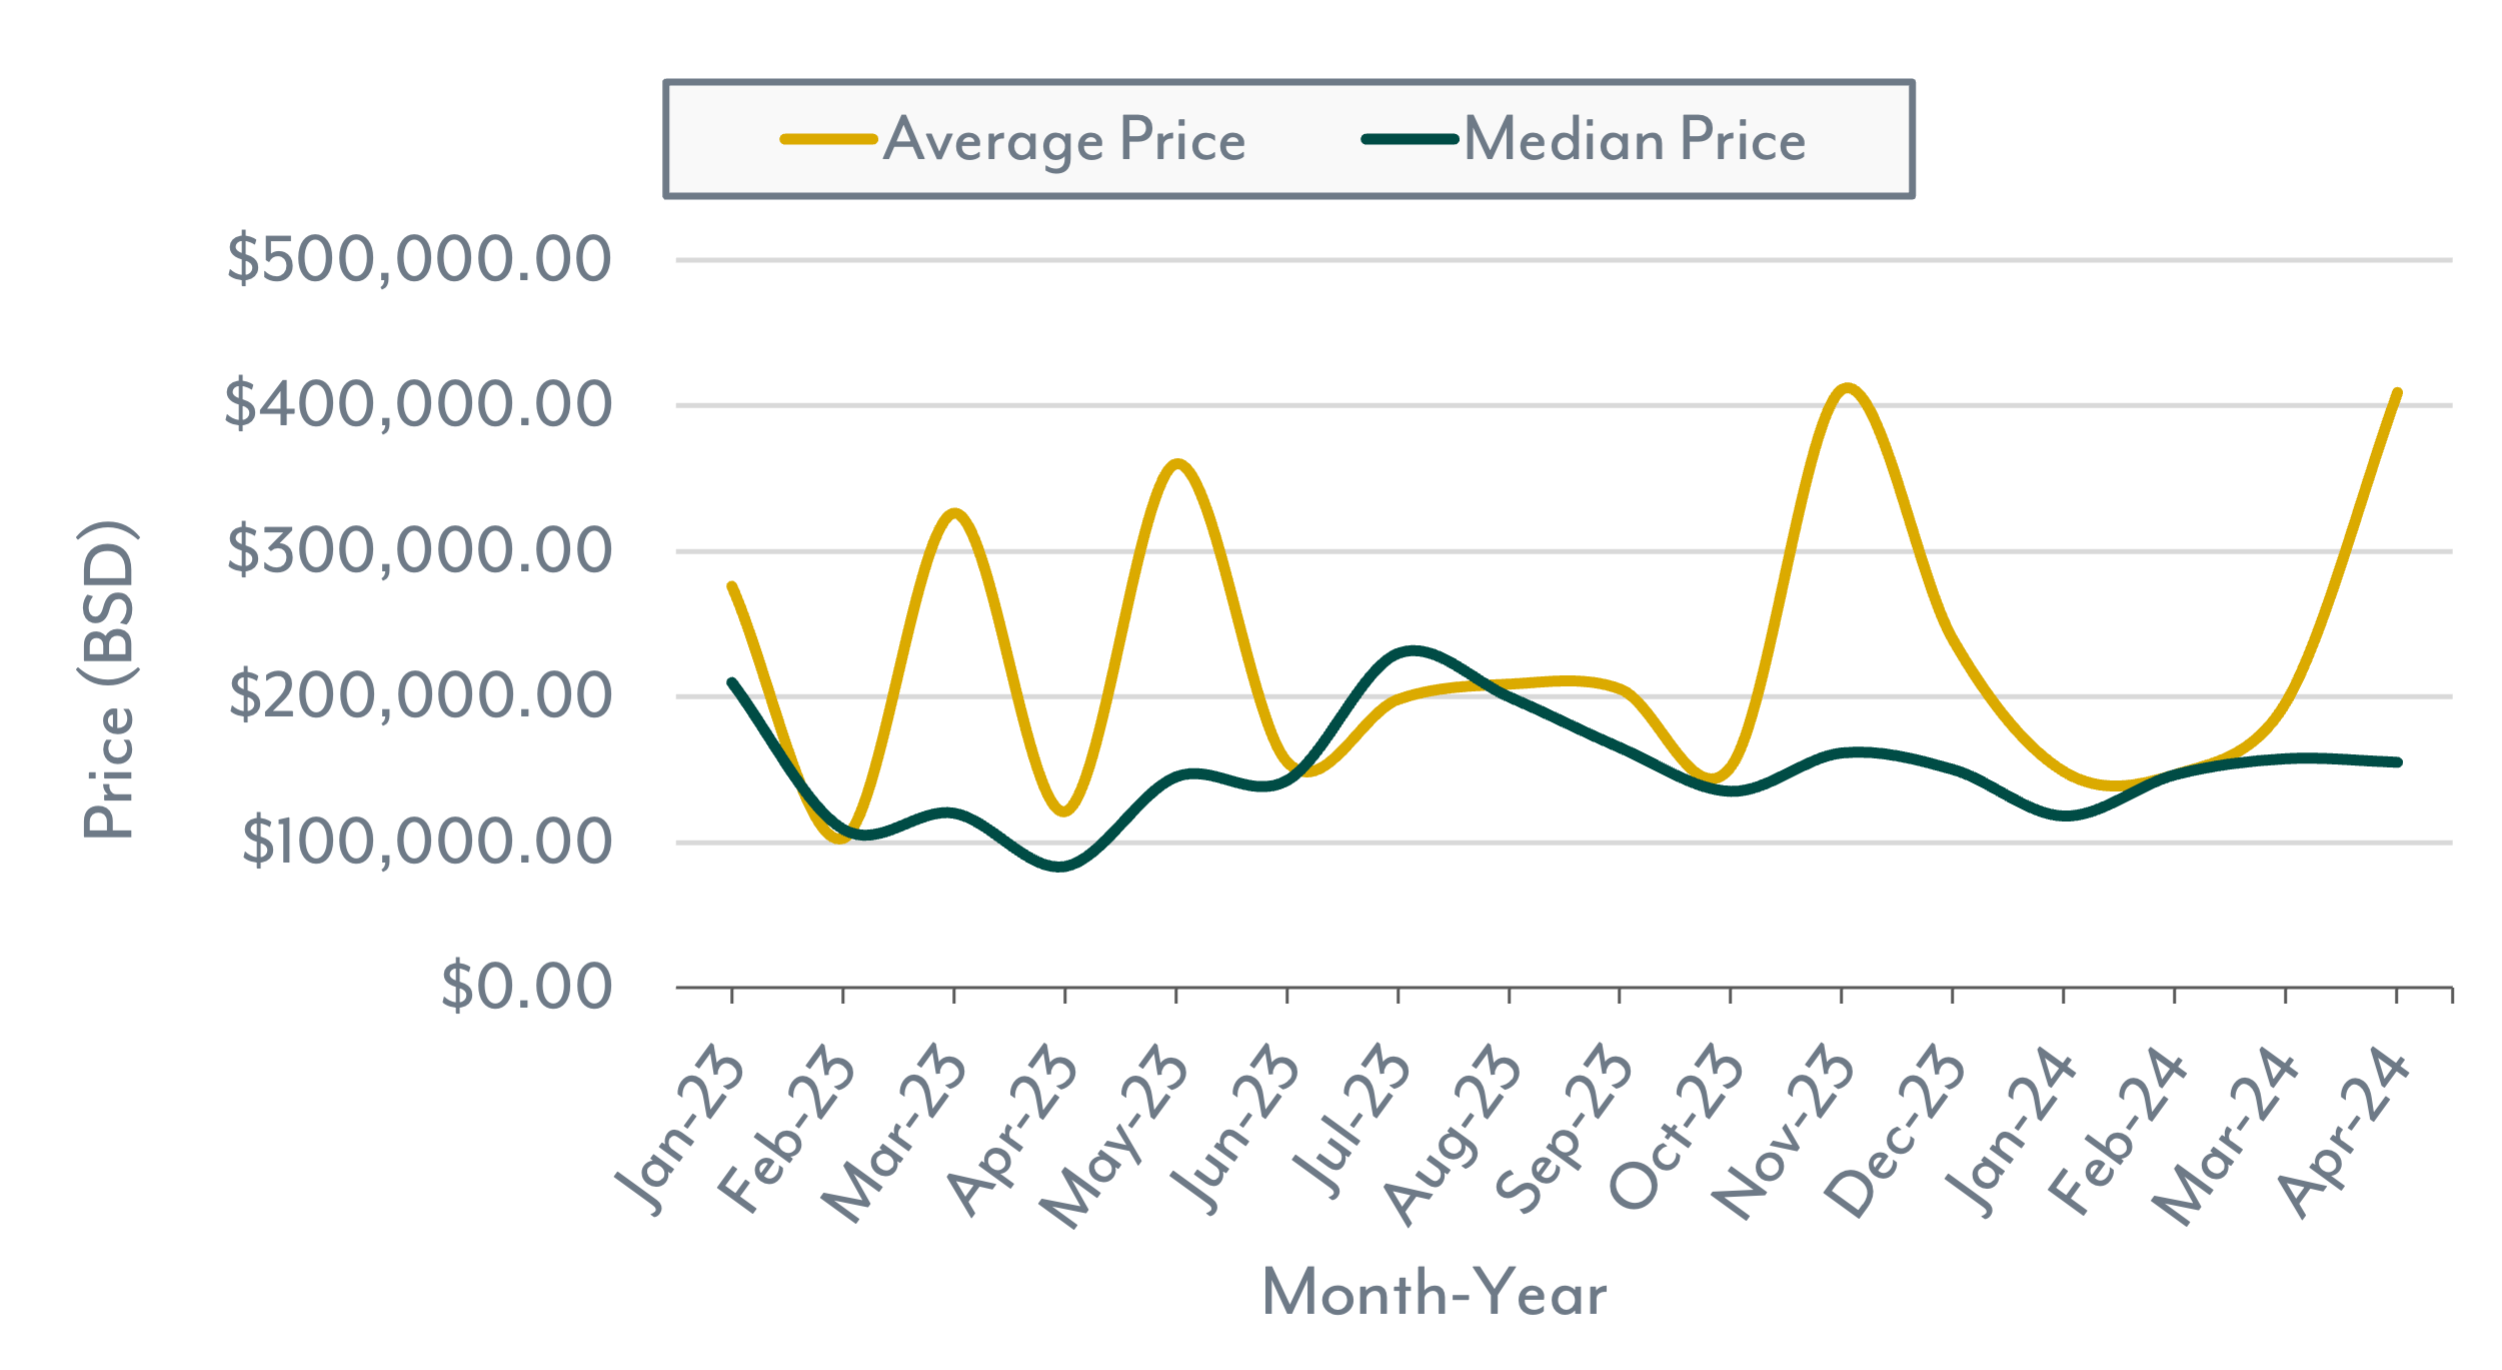
April 2024 witnessed a notable jump in home prices, largely influenced by a single high-end sale, though the year-to-date measurements provide a clearer understanding, revealing slight decreases in the Median Price by 4.1% but significant increases in Average Price by 45.4%. Consequently, it's reasonable to anticipate a return to the normal price range for both Median Prices and Average Prices next month.
In terms of Days on the Market, minor changes have been observed with a decrease of 13.9% compared to April of the previous year but a marginal increase of 0.9% year-to-date, translating to only slight differences of 11 days and 1 day, respectively.
Lastly, the Average List/Sale Price Ratio has seen fluctuations, decreasing slightly by 1.5% compared to the previous year but showing an increase of 1.9% year-to-date. With these diverse market dynamics, there are certainly interesting trends worth closely monitoring.
Home Market Indicators
New Listings, Contracted Sales & Completed Sales

Average & Median Price


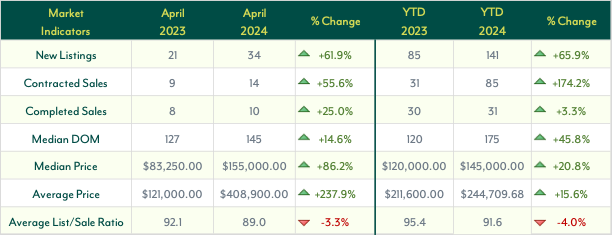
The land market in Nassau and Paradise Island, much like the housing market, is beginning to stabilize following its peak in February 2024. Despite a decrease in demand earlier this year, April 2024 saw a significant 55.6% increase compared to April 2023. Year-to-date comparisons reveal an even more substantial jump of 174.2% in Contracted Sales in 2024 versus 2023. Completed Sales of land also experienced growth, with a 25% rise year-over-year and a 3.3% increase YTD. New Listings rose by 61.9% year-over-year and 65.9% YTD. While the numbers may not provide as clear of a picture, the graph helps demonstrate that supply and demand are converging in volume compared to previous months.
The Median Price for land seems to be stabilizing around the $150,000 mark, showing an 86.2% increase from April 2023 to April 2024. However, it's worth noting that April 2023 marked the lowest price observed in the past two years, while April 2024's figures closely resemble those seen earlier this year. In contrast, the Average Price surged 237.9% year-over-year in the previous month. This increase is attributed to a few high-end sales in April 2024, which skewed the average. Therefore, YTD comparisons provide a more accurate picture of the market's behavior. For the YTD comparisons, the average price remained very similar, with only a 15.6% increase in 2024 compared to the same period in 2023. The same can be said for the median price as it experienced a similar increase of 20.8%.
In April 2024, the median Days on the Market remained similar to April 2023, with only a 14.6% increase, equivalent to an 18-day difference. To assess the validity of these increases, year-to-date comparisons for the first four months of 2023 and 2024 show an overall 45.8% increase. So, while there have been increases, these numbers remain relatively similar.
While the average List/Sale Price Ratio was trending upward in the first three months of this year, April 2024 has brought a notable decrease. Compared to April 2023, this ratio has dropped by 3.3%, with year-to-date (YTD) comparisons showing a similar decrease of 4%. Notably, this marks the second lowest point for this ratio in the past two years, indicating that sellers have shown greater flexibility in their sale prices.
Land Market Indicators
New Listings, Contracted Sales & Completed Sales
Average & Median Price
Not sure if you are ready to buy or sell?
We're able to explain what these numbers mean for you and better guide you to make an informed decision that is best for you based on the current market conditions.