
Our monthly Market Report provides meaningful and valuable information, to empower buyers and sellers who are considering a real estate transaction in Nassau or Paradise Island (Bahamas).
If you're considering selling your property or buying property on Nassau or Paradise Island, it's essential to understand what's happening in The Bahamas' real estate market. Knowing the most important data, such as median and average prices, the number of properties sold, the number of new listings, and the days on the market will better prepare you for selling or buying.
We are happy to share our February 2024 analysis of the Nassau and Paradise Island market. We also encourage you to review our quarterly market reports on Abaco, Eleuthera, Exuma, Grand Bahama and New Providence.
Our market reports provide Morley's interpretation of the data from the Bahamas Real Estate Association MLS. Even though the MLS does not include all real estate sales and related real estate data, we believe the MLS data is reasonable and consistent to be reliable to use to estimate local real estate trends.

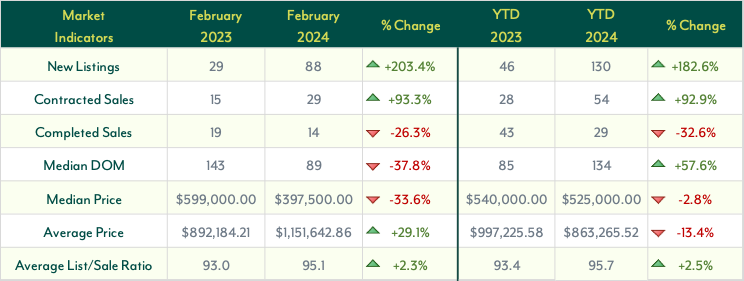
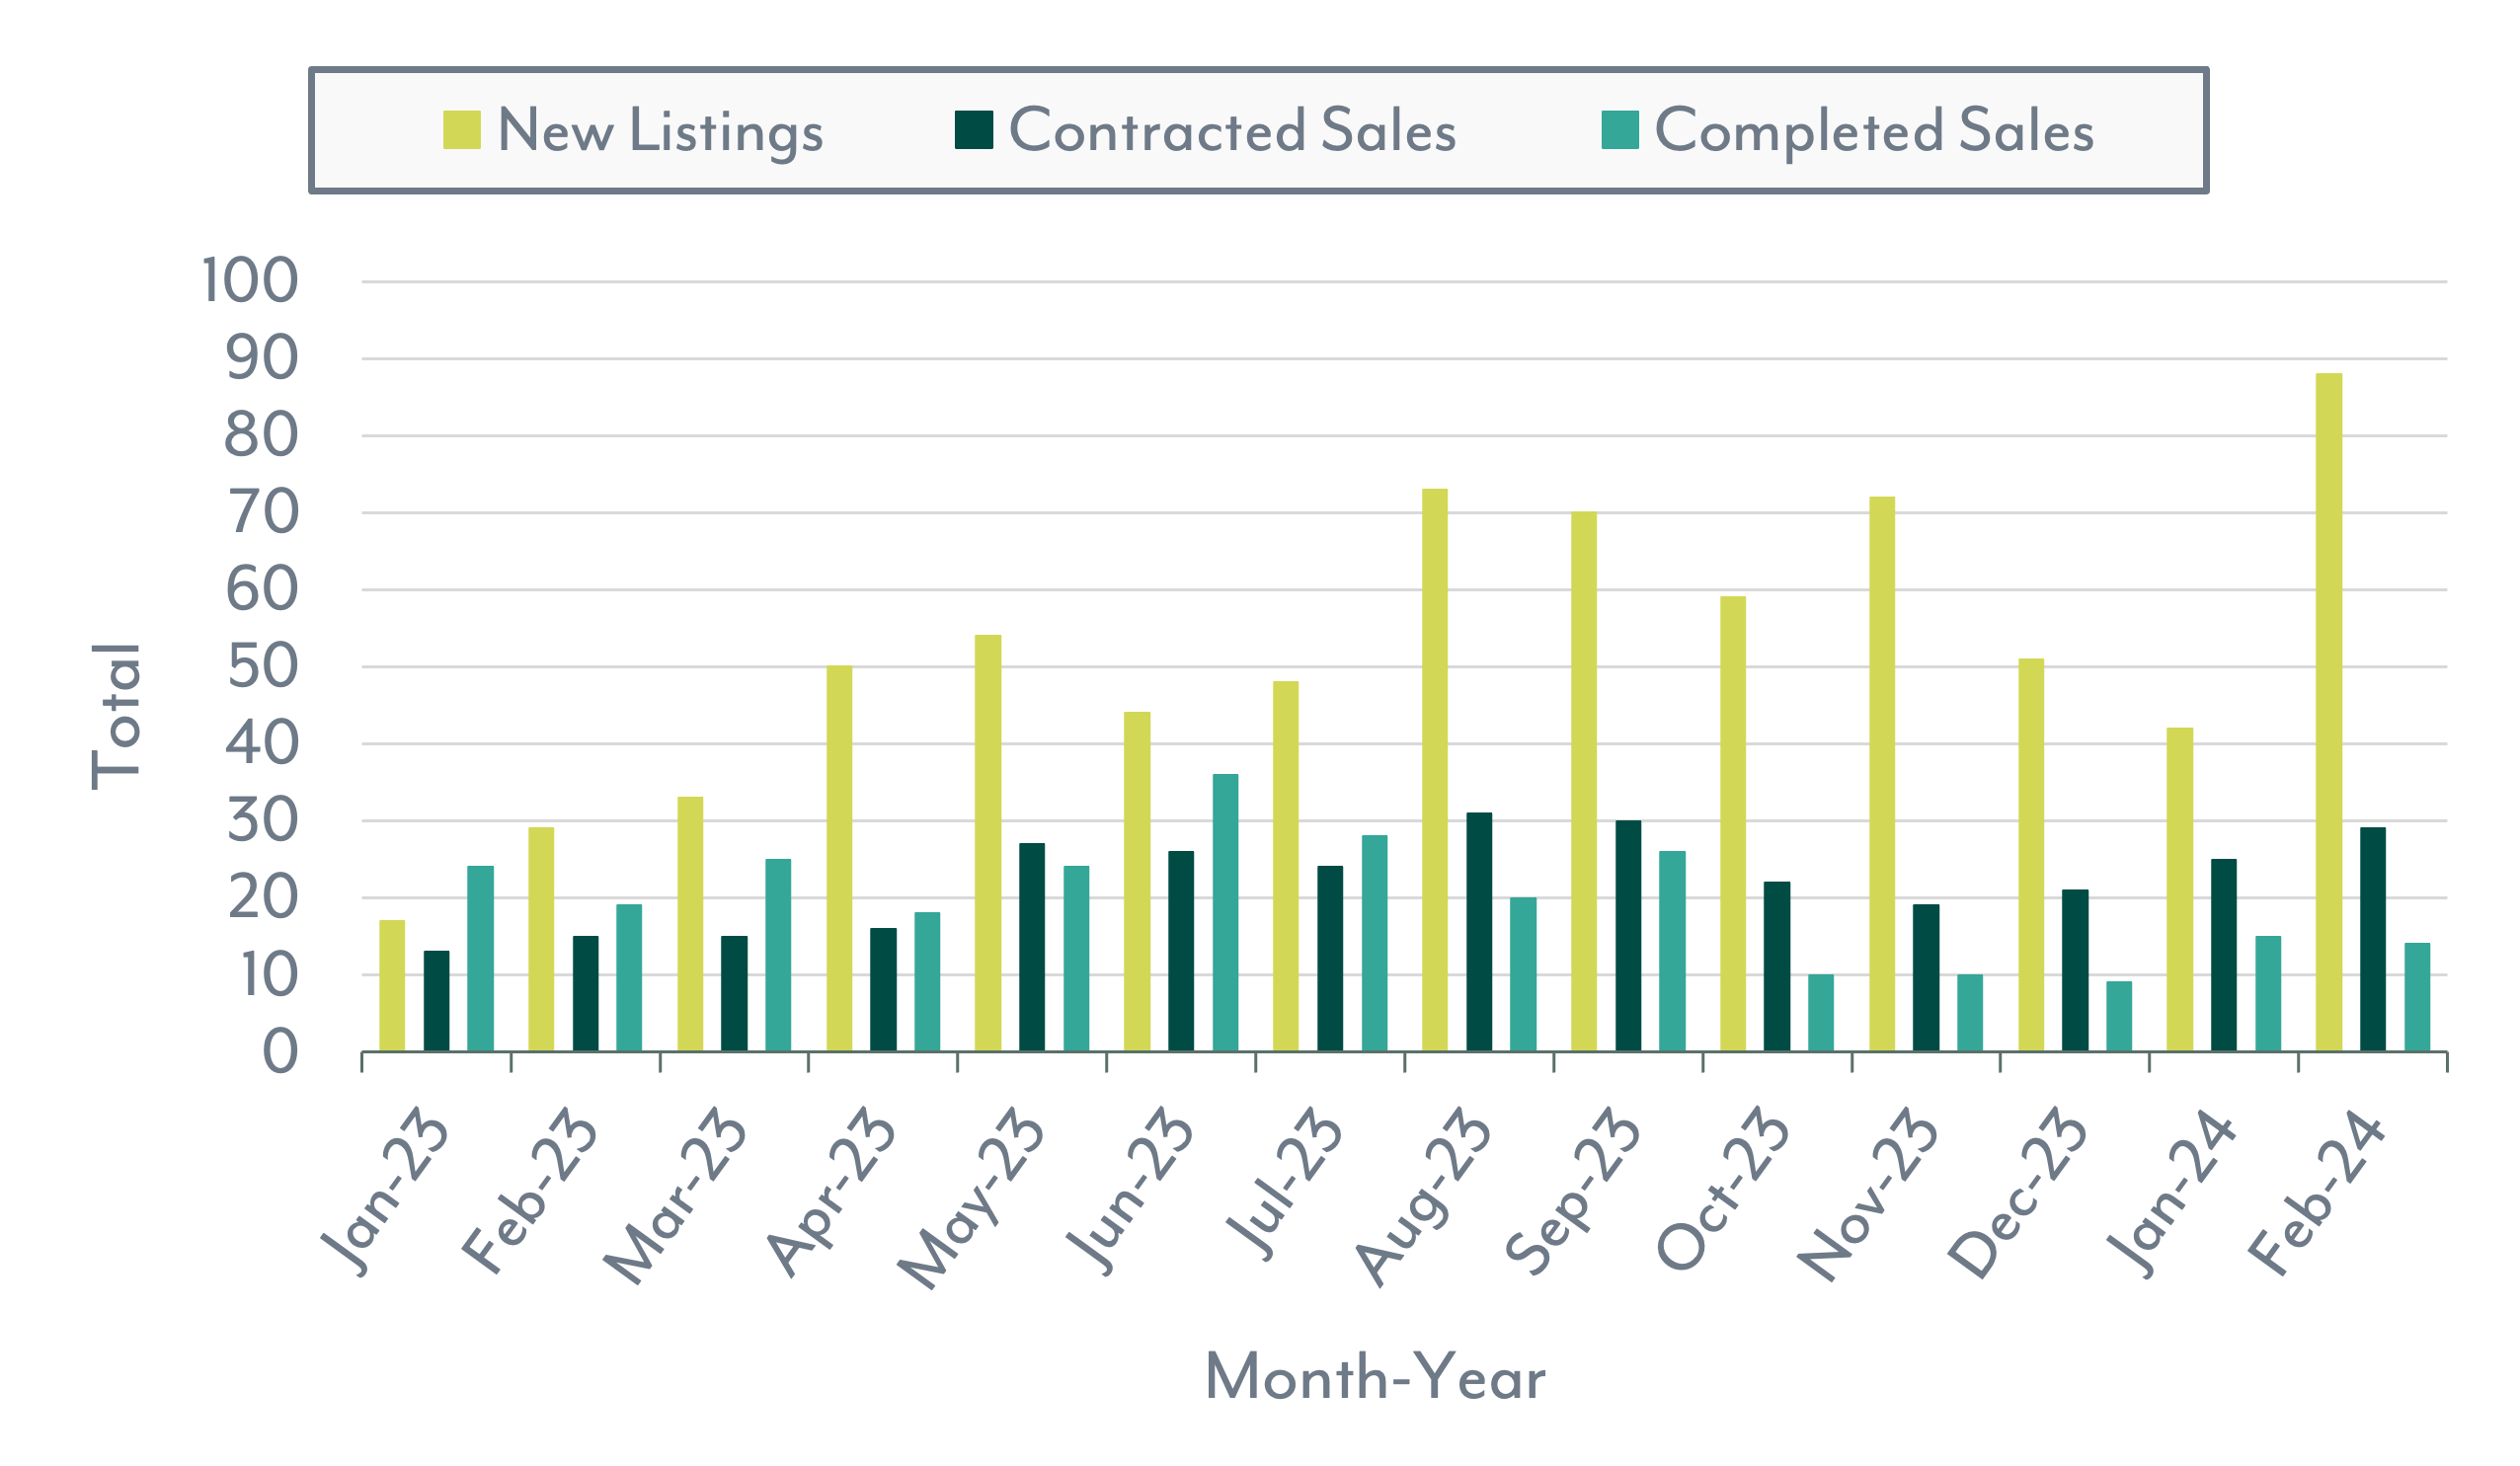
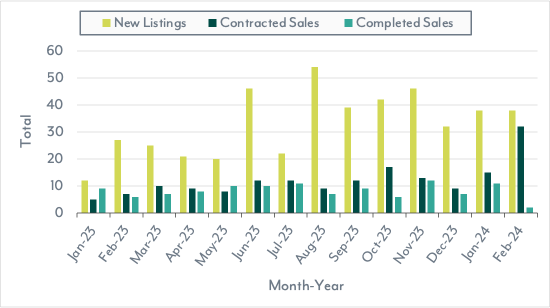
The Nassau and Paradise Island housing market remains strong, with February 2024 witnessing a record-high monthly total of 88 new home listings during the last 2 years, which is more than double the figure from February 2023 (+203.4%). Year-to-date new home listings comparisons for 2023 and 2024 show similar substantial increases of +182.6%. Contracted home sales continue to rise steadily, with February 2024 showing a notable increase of +93.3% compared to February 2023. The Year-to-date comparison also reveals nearly an identical increase of +92.9%. However, completed home sales experienced a decline, with a decrease of -26.3% from February 2023 to February 2024, and a slightly larger decrease of -32.6% in year-to-date comparison for 2023 and 2024.
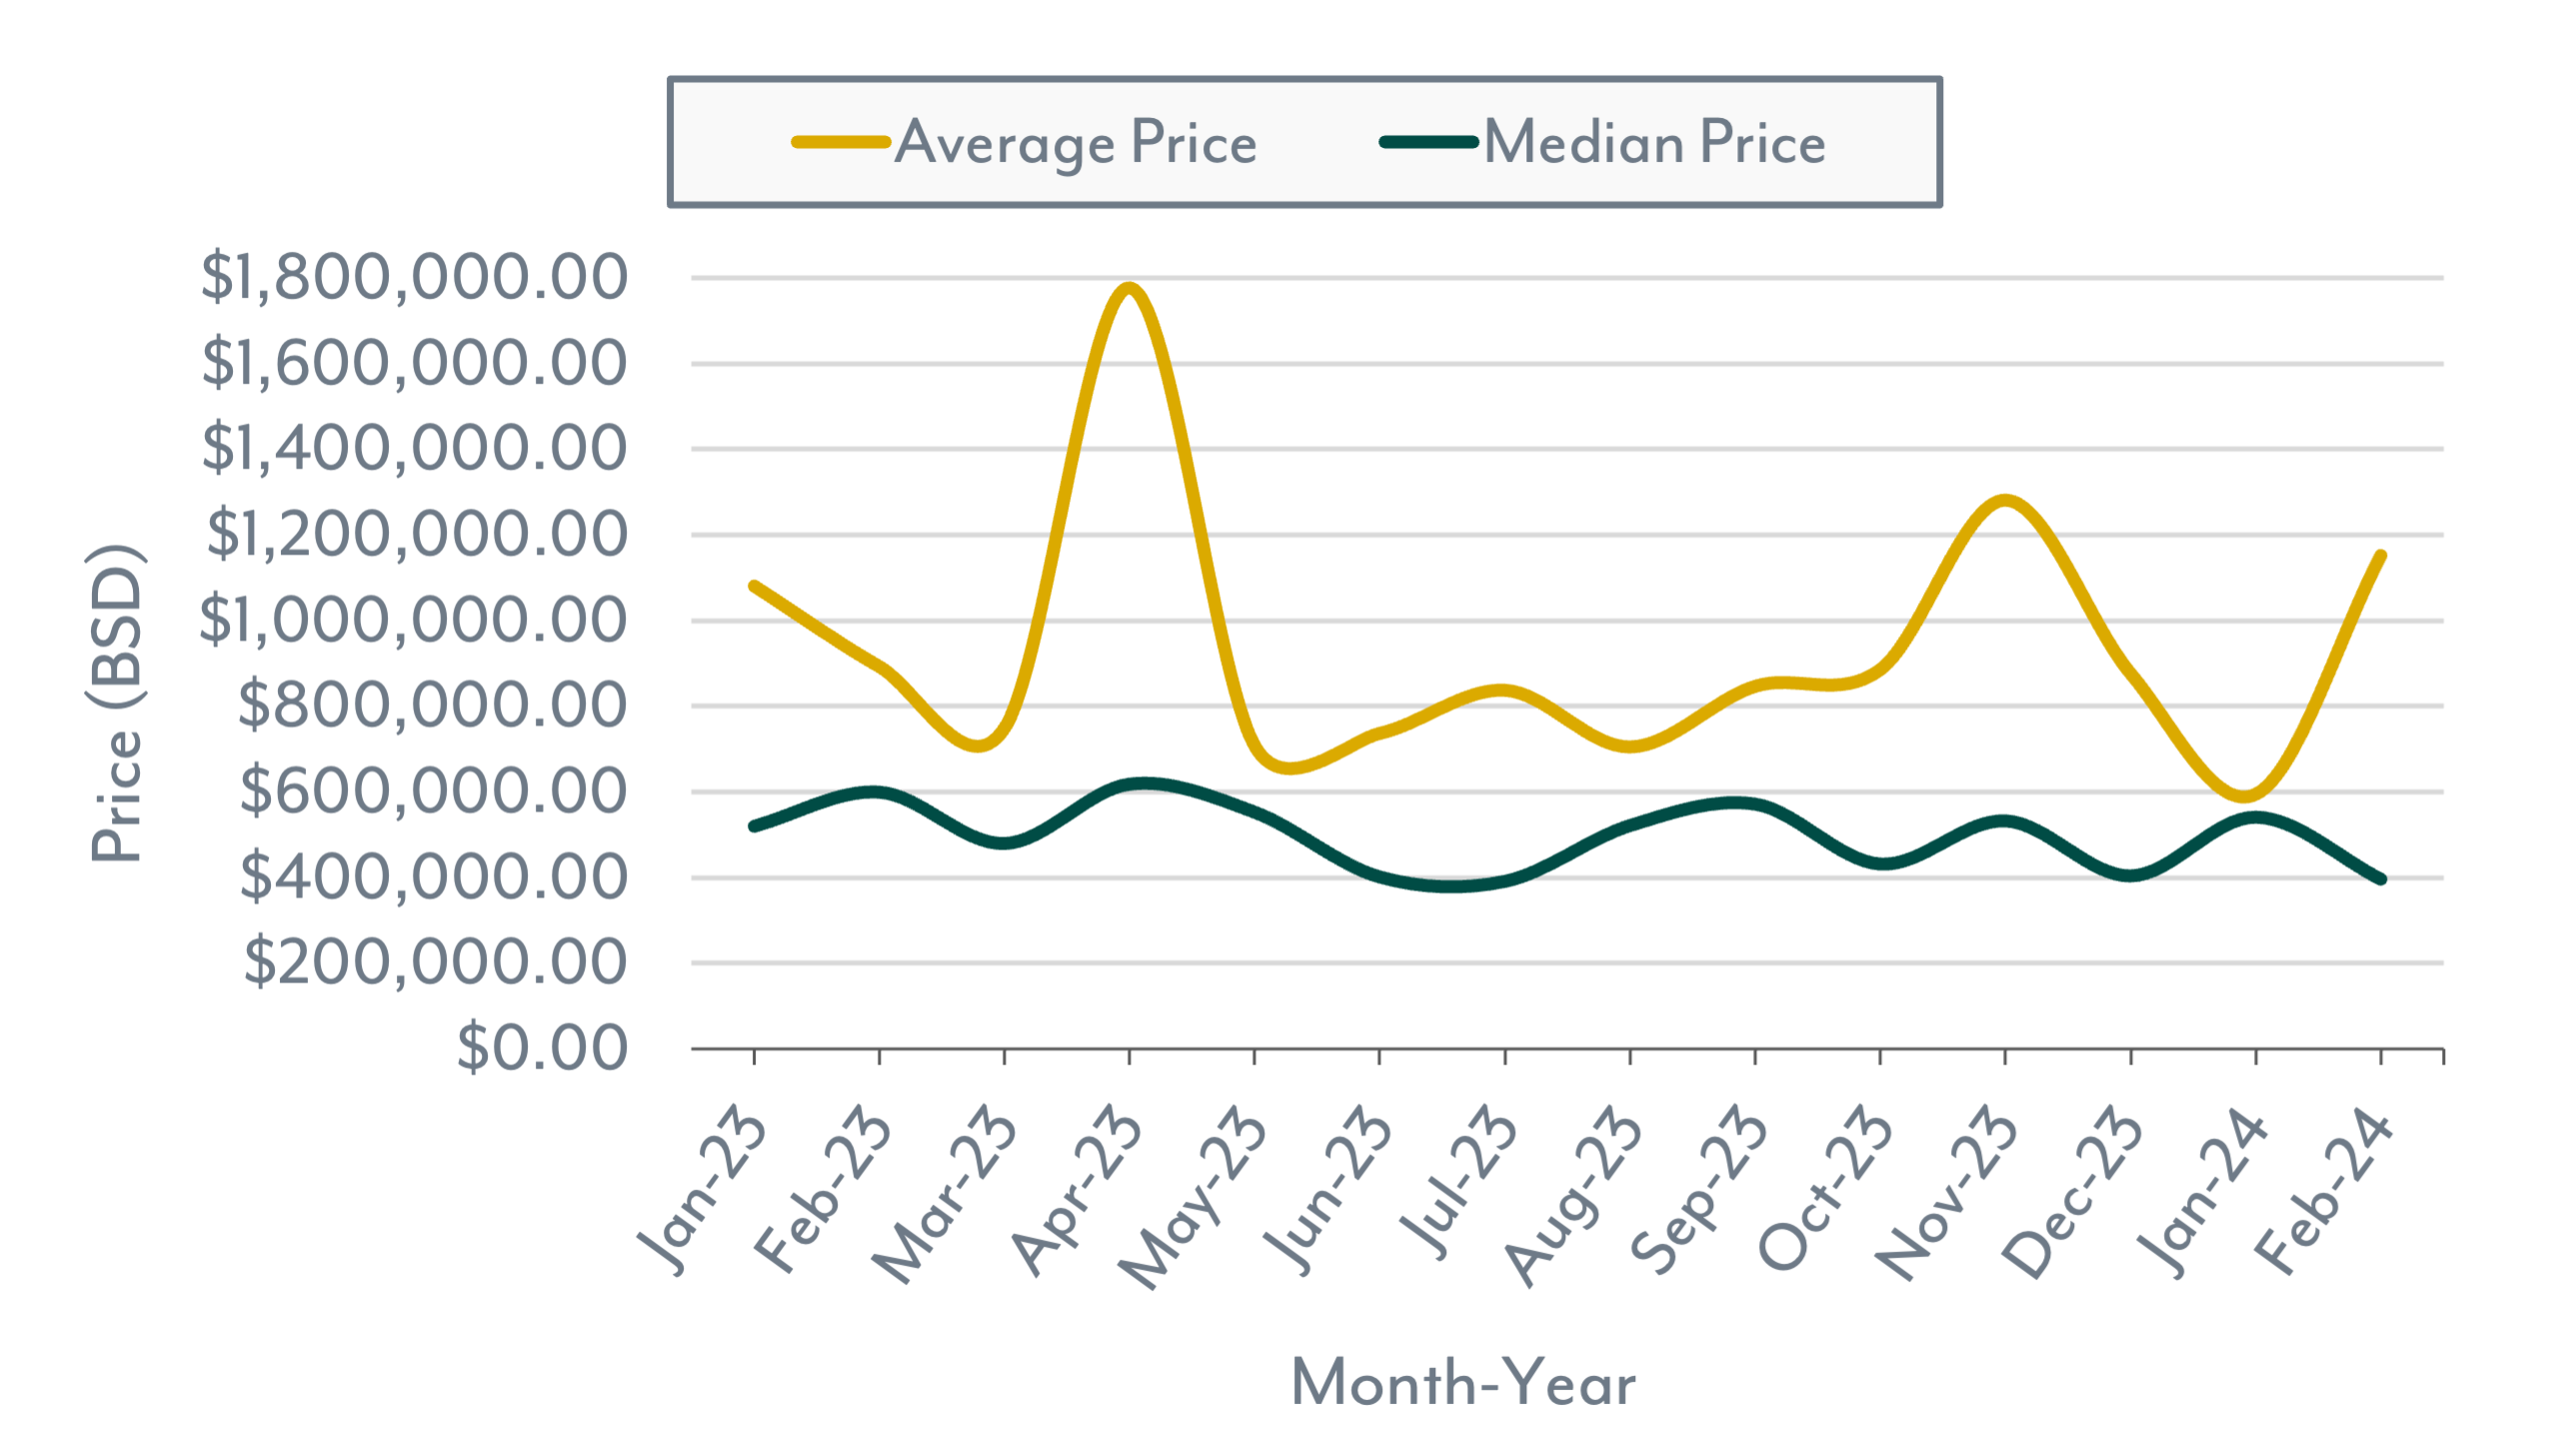
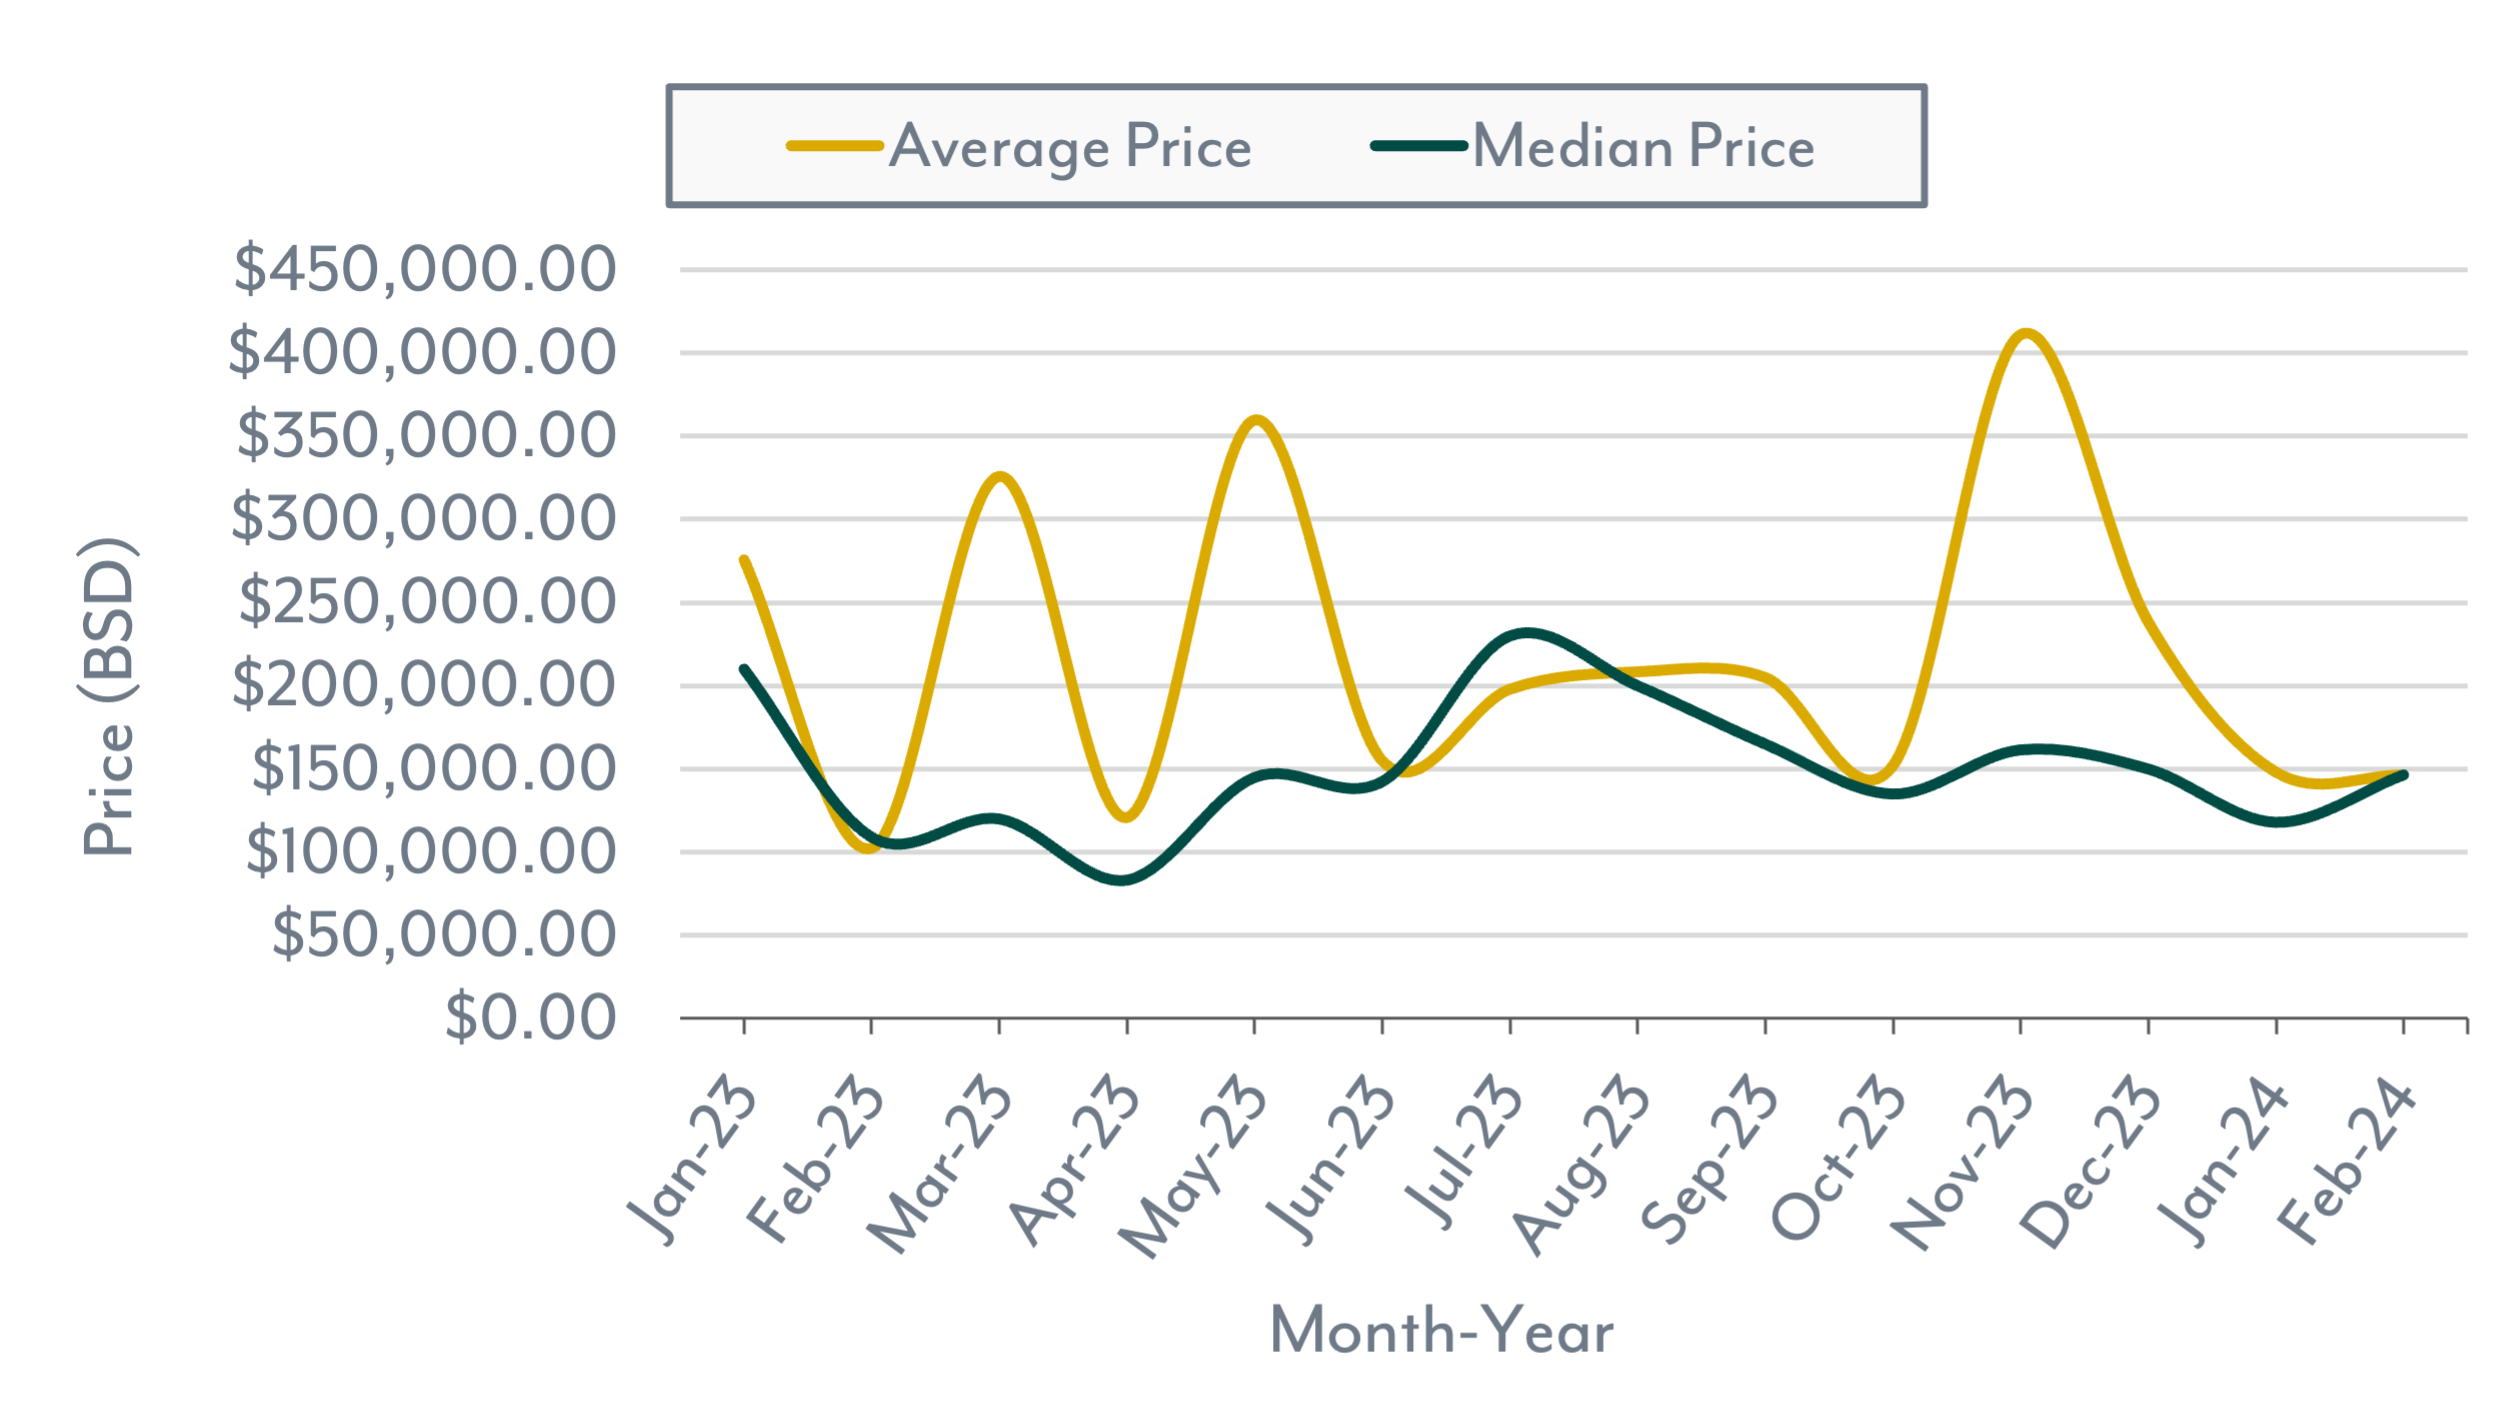
Regarding sales prices, the median has remained relatively stable, consistent with the past 2 years. However, comparing February 2023 to February 2024, there's a notable decrease of -33.6%. Year-to-date figures for 2023 and 2024 show nearly identical median prices, with 2024 slightly lower by -2.8%. Conversely, the average price reflects a spike in February due to a few multi-million-dollar sales, resulting in a larger difference between the average and median prices.
The Median Days on the Market (DOM), different from other variables previously mentioned, experienced a significant decrease of -37.8% from February 2023 to February 2024. However, when comparing the year-to-date figures for 2023 and 2024, there was an increase of +57.6%.
The Average List/Sale Ratio saw a decrease following last month's spike. However, compared to February 2023, there was a +2.3% increase. Similarly, when examining year-to-date figures for 2023 and 2024, there's a near-identical increase of +2.5%.
Home Market Indicators
New Listings, Contracted Sales & Completed Sales
Average & Median Price

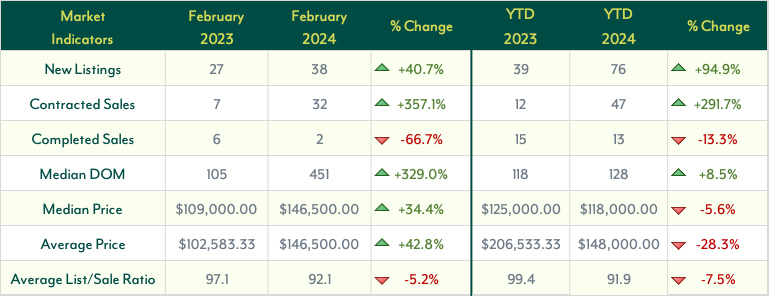
The Nassau and Paradise Island land market remains strong. February 2024 experienced the highest number of contracted land sales we have seen in the last 2 years, reaching 32. This marks a +357.1% increase in contracted sales from February 2023 and a +291.7% increase when comparing the year-to-date of 2023 and 2024. However, completed land sales declined, showing a decrease of -66.7% from February 2023 to February 2024, and a -13.3% decrease in year-to-date comparisons between 2023 and 2024. New listings for land remained similar to January 2024 but surged by +40.7% compared to February 2023. Moreover, year-to-date comparisons for 2023 and 2024 of new land listings reveal a substantial increase of +94.9%.
The median price for land has continued its decreasing trend since July 2023, although there was a slight increase from January 2024. Observing the graph, we notice this median price is gradually approaching the levels seen in February 2023, but still reflects a notable increase of +34.4%. In year-to-date comparisons for 2023 and 2024, there is a slight decrease of -5.6%. The median and average sales prices are equal as there were only 2 completed sales in February 2024.
In February 2024, the Median Days on the Market (DOM) witnessed a notable increase of +329% from February 2023. However, with only 2 completed sales this month, it may not be the most accurate representation of DOM. In this scenario, comparing year-to-date figures for 2023 and 2024 provides a more reliable comparison. Looking at the year-to-date data, there was an increase of +8.5%.
The Average List/Sale Ratio stayed relatively consistent with January 2024. However, in general, February 2024 shows a lower ratio compared to other months in the past 2 years. There's a decrease of -5.2% compared to February 2023 and a -7.5% decrease in year-to-date comparisons for 2023 and 2024.
Land Market Indicators
New Listings, Contracted Sales & Completed Sales
Average & Median Price
Curious about whatyour home or property is worth now?
We're able to explain what these numbers mean for you and your home's or property's current market value.