.png)
Our monthly Market Report provides meaningful and valuable information, to empower buyers and sellers who are considering a real estate transaction in Nassau or Paradise Island (Bahamas).
If you're considering selling your property or buying property on Nassau or Paradise Island, it's essential to understand what's happening in The Bahamas' real estate market. Knowing the most important data, such as median and average prices, the number of properties sold, the number of new listings, and the days on the market will better prepare you for selling or buying.
We are happy to share our January 2024 analysis of the Nassau and Paradise Island market. We also encourage you to review our quarterly market reports on Abaco, Eleuthera, Exuma, Grand Bahama and New Providence.
Our market reports provide Morley's interpretation of the data from the Bahamas Real Estate Association MLS. Even though the MLS does not include all real estate sales and related real estate data, we believe the MLS data is reasonable and consistent to be reliable to use to estimate local real estate trends.

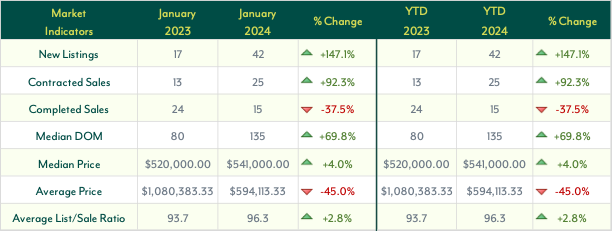
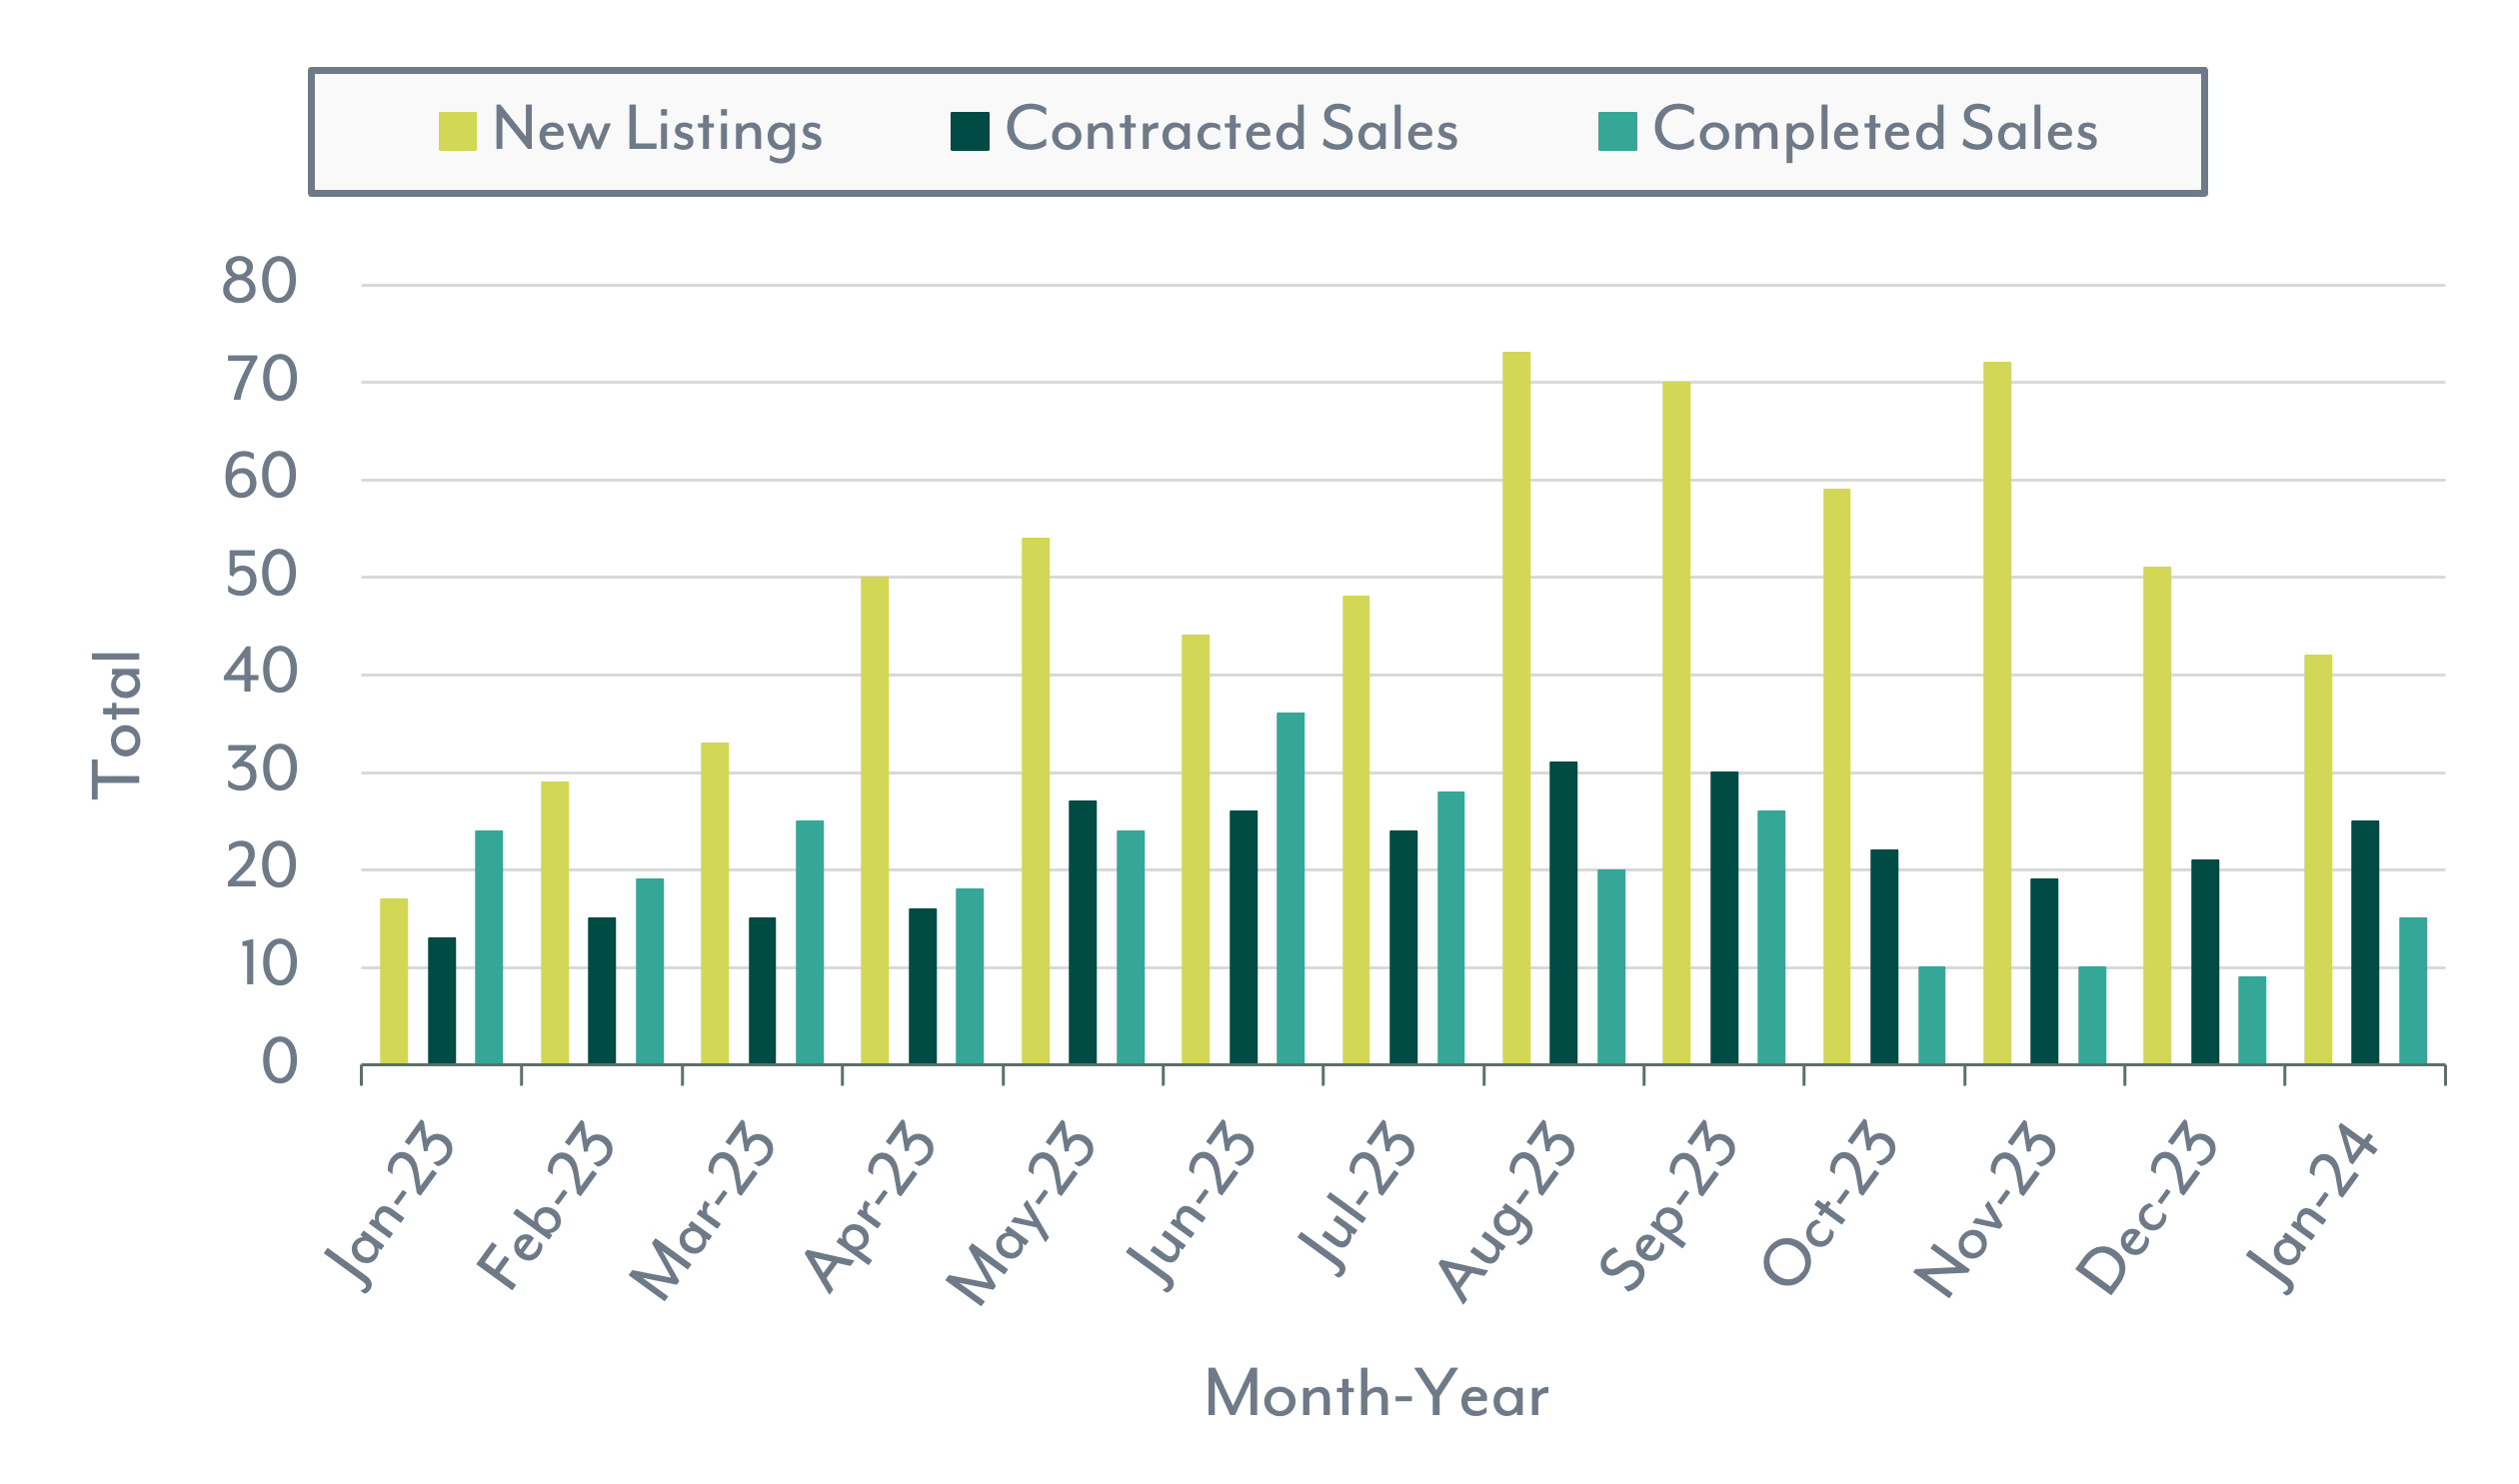
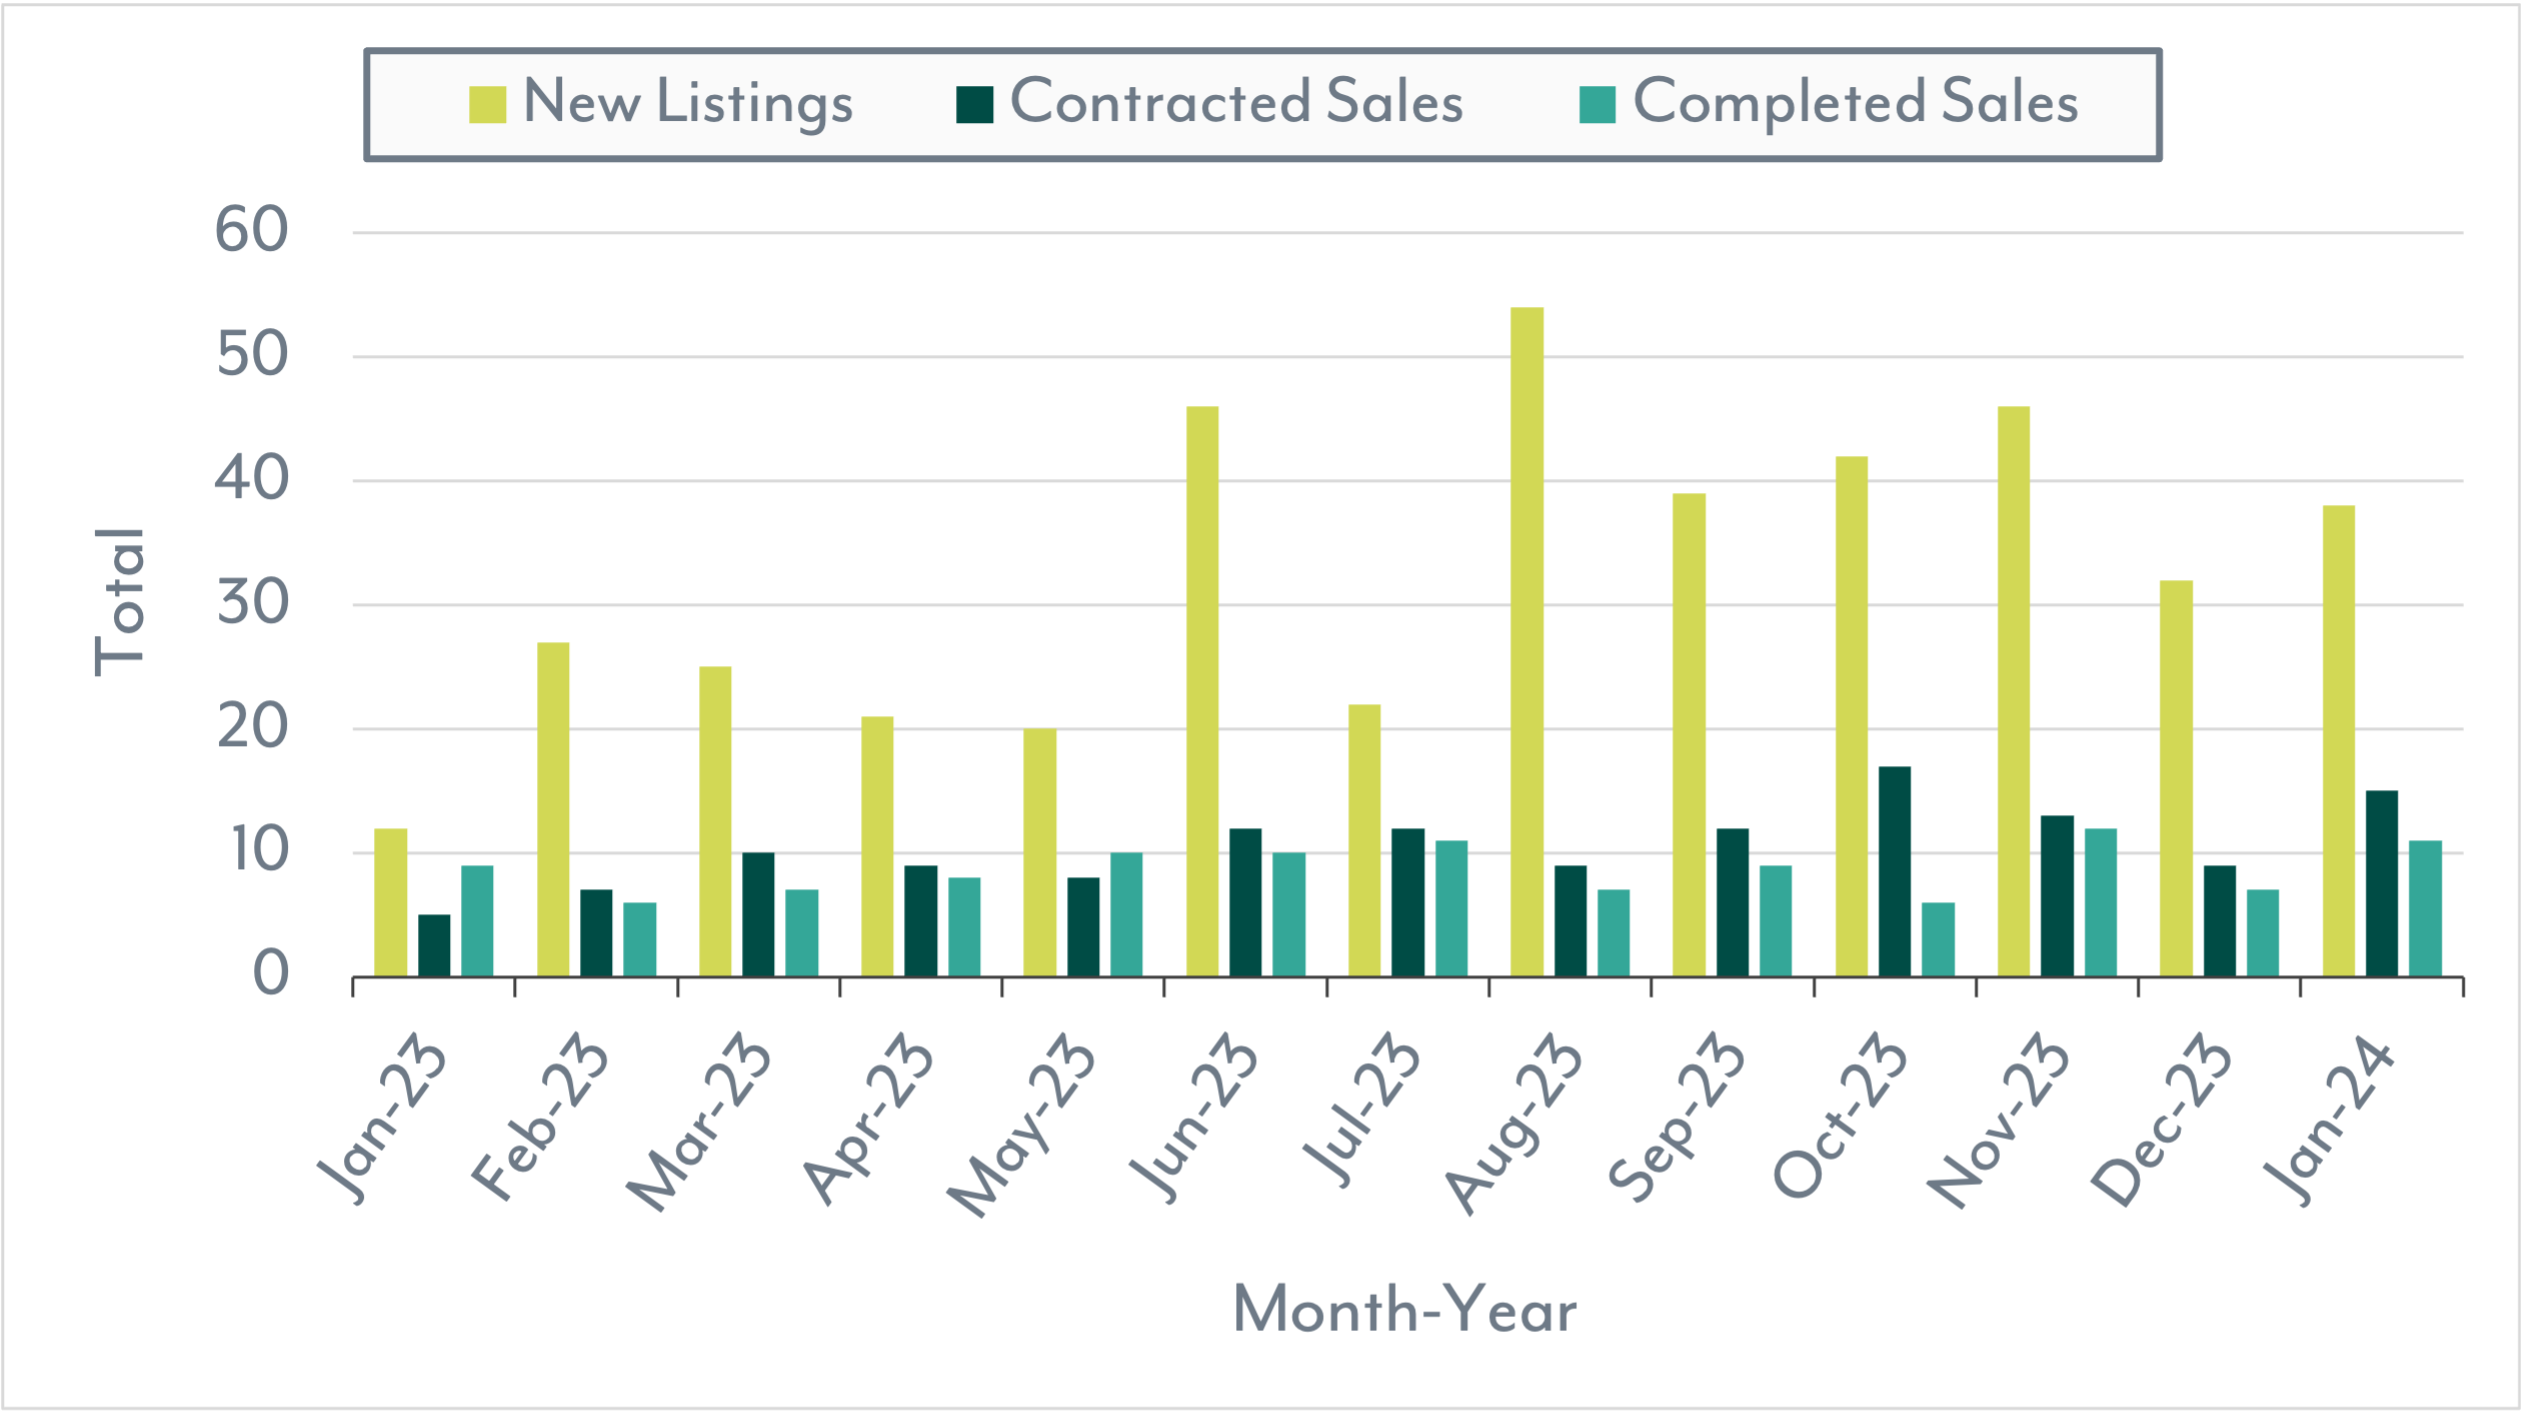
New home listings in January 2024, declined to 42 from November 2023's 72, yet this still represents a substantial increase (147.1%) compared to January 2023's 17 new home listings. Contracted home sales climbed to 25, up from both December 2023 (21) and January 2023 (13). Completed home sales totaled 15, down 37.5% from January 2023 but up 66.6% from December 2023. With new home listings still exceeding contracted and completed home sales, in the Nassau and Paradise Island market, the supply of available homes continues to increase.
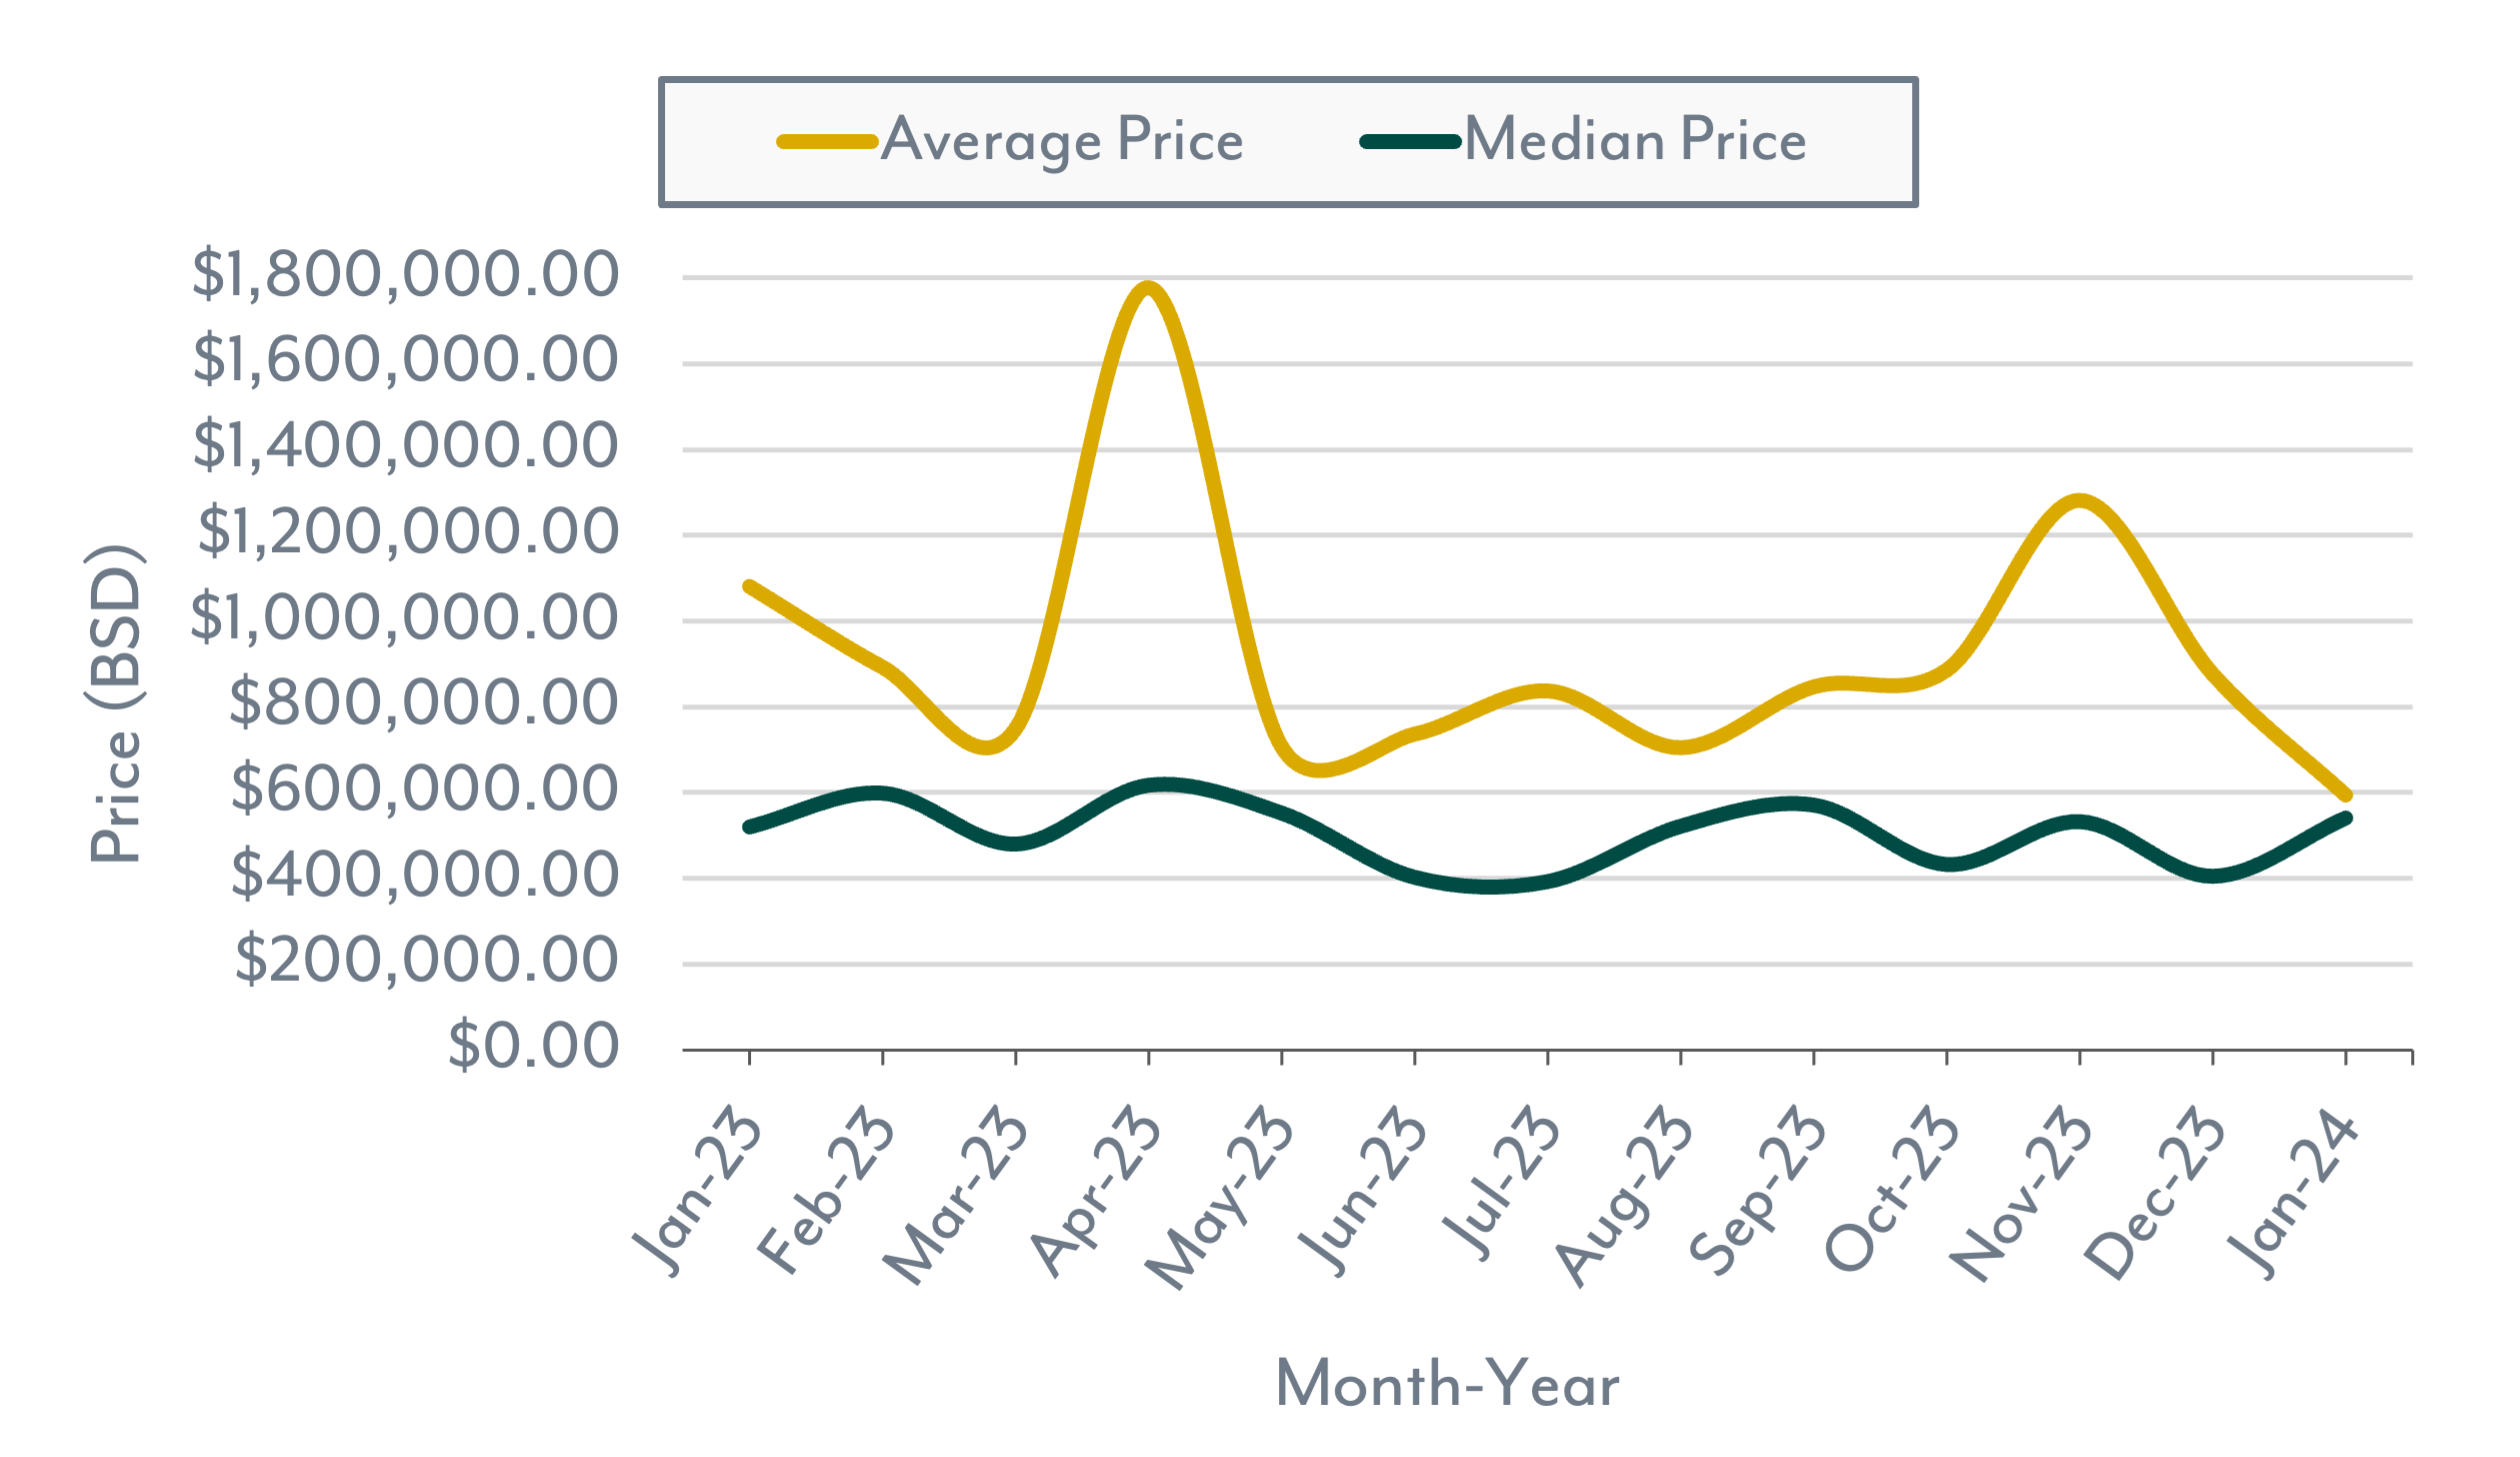
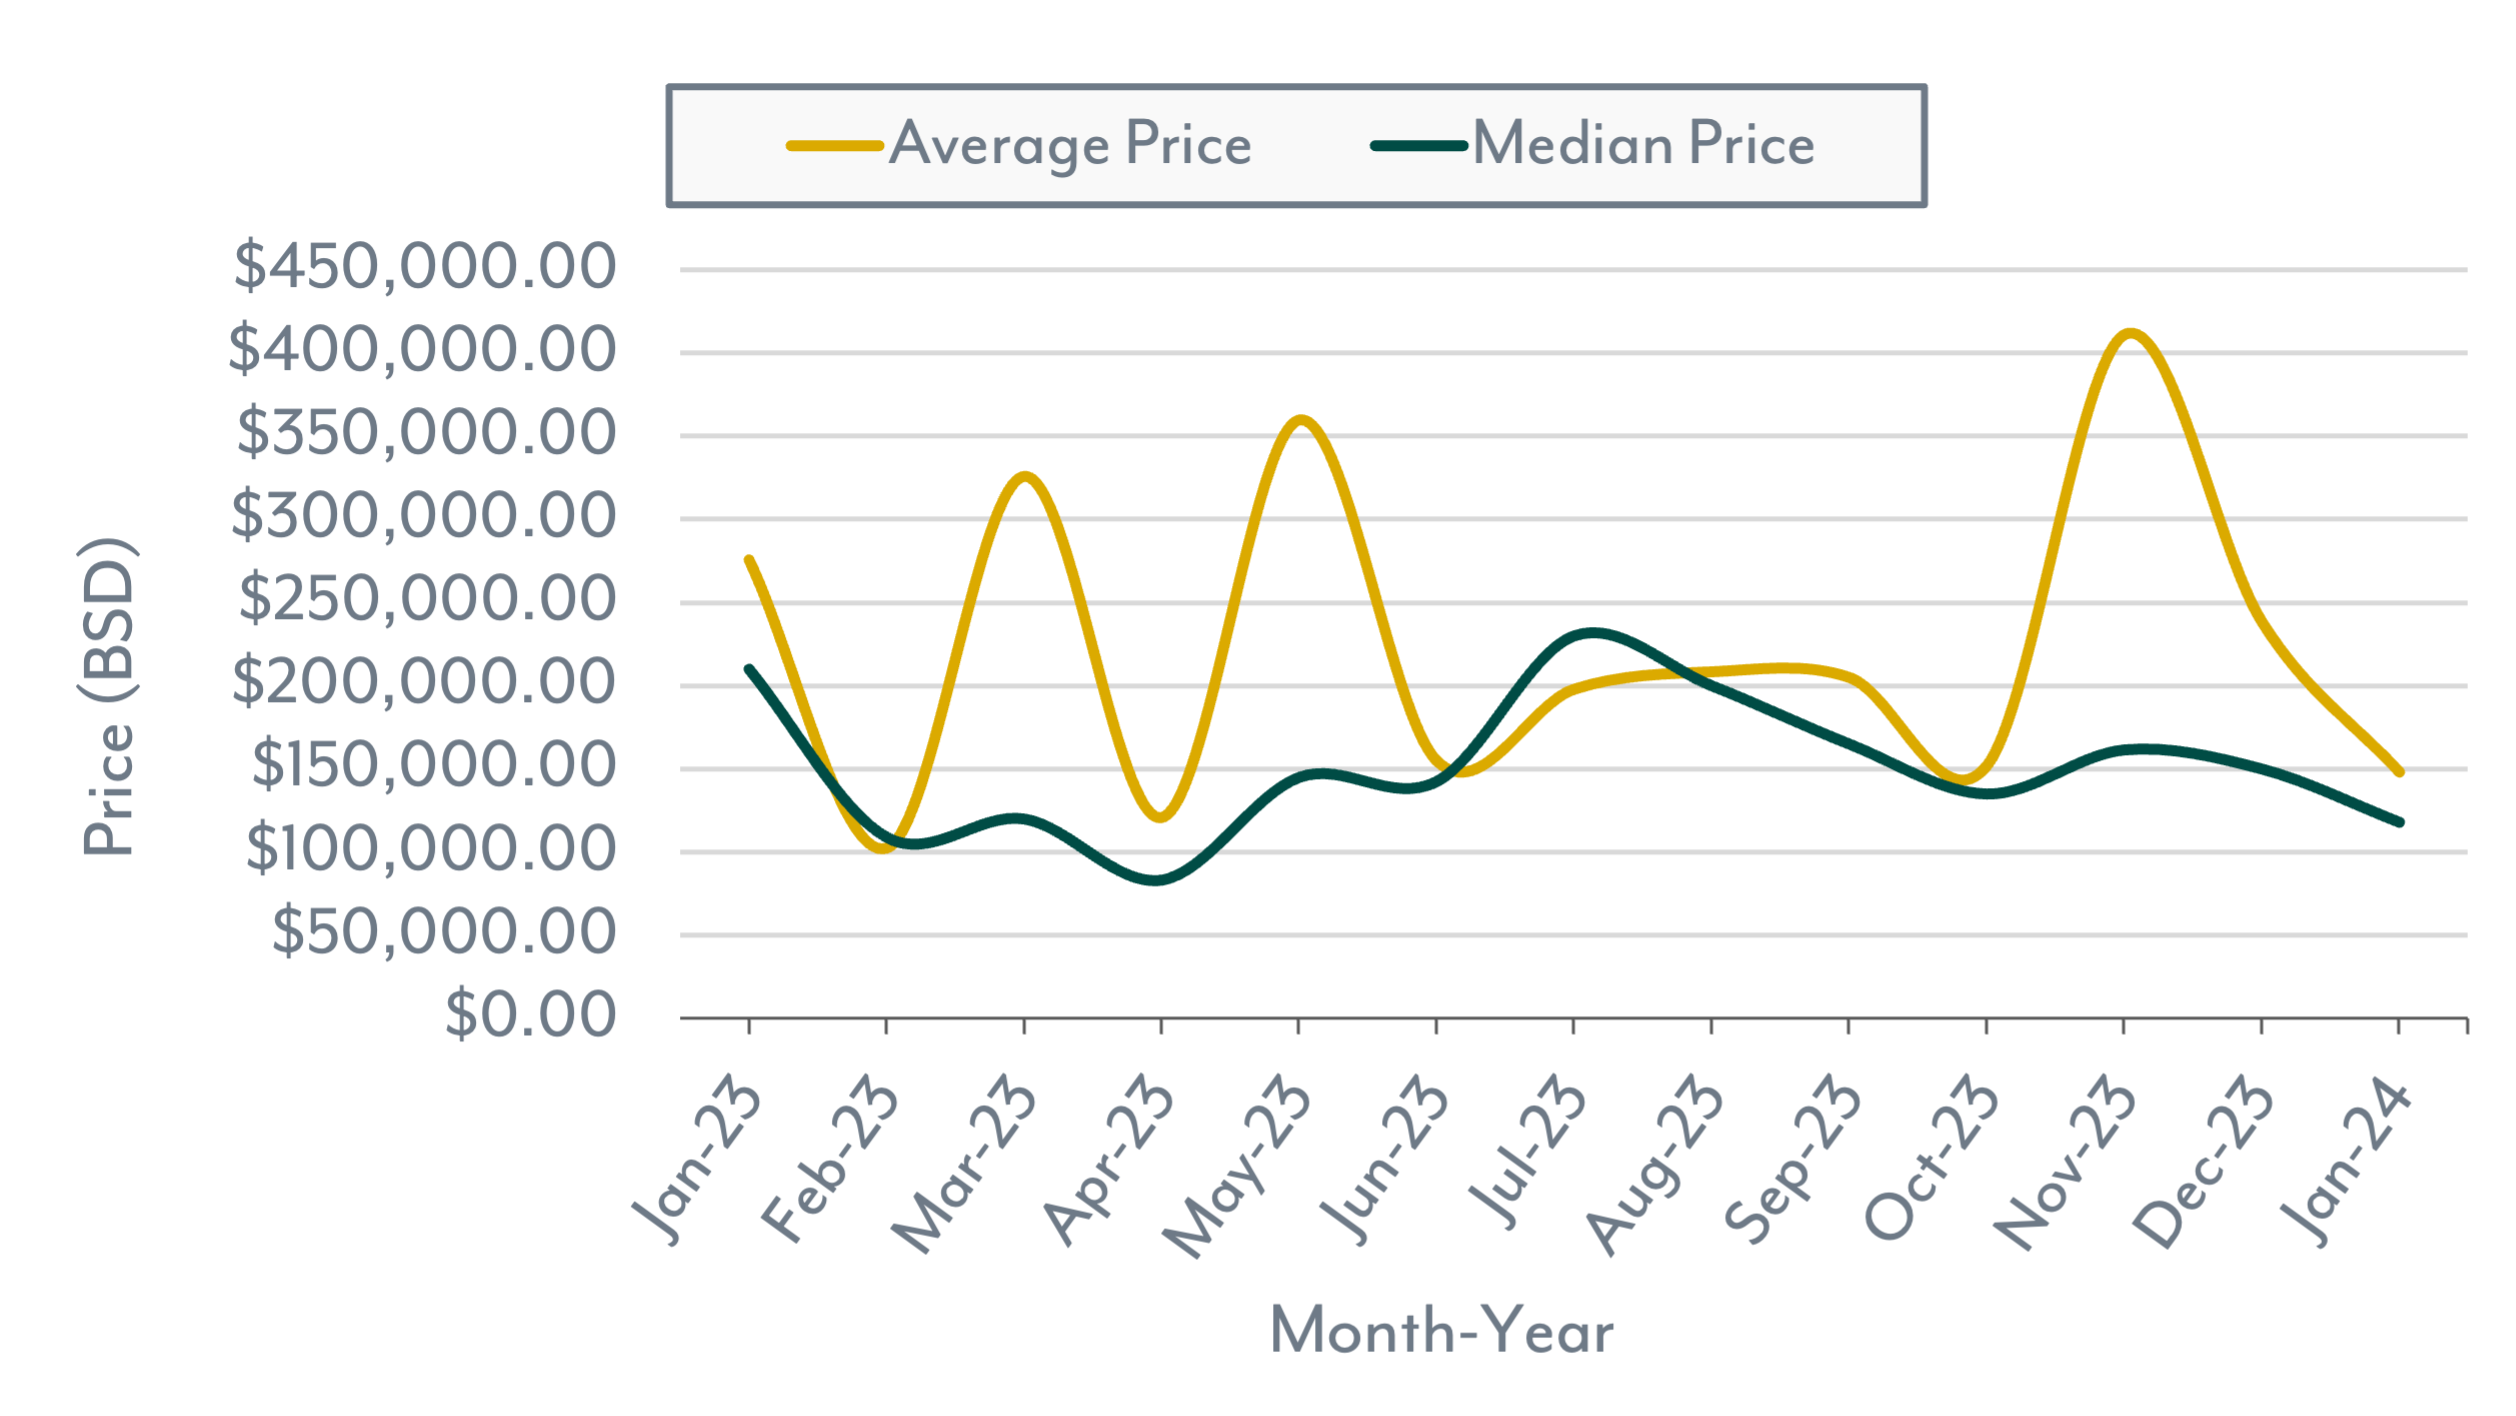
The median home sales price rose by 4% over the January 2023. Despite this increase, the median home sales price has remained relatively stable over the past five months. Conversely, the average home sales price has significantly dropped, with a 45% decline when compared to January 2023.
The median Days on the Market (DOM), like the median sales price, increased to 135 days, reflecting a 69.8% rise when compared to January 2023 (80 days).
Lastly, the average list/sale price ratio (96.3%) also experienced an increase when compared to January 2023 (93.7%). Additionally, we can see that January 2024 is the highest this ratio has been in the past year.
Home Market Indicators
New Listings, Contracted Sales & Completed Sales
Average & Median Price

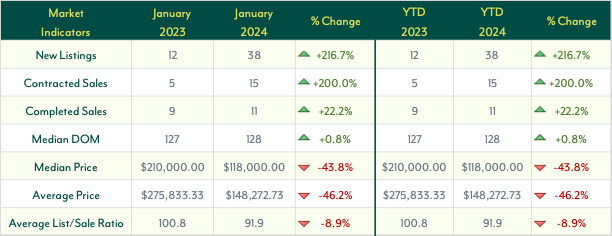
New land listings in January 2024, increased to 38, nearly hitting the highest monthly total in all of the past year. January's 2024 figure represents a significant surge, with a 216.7% increase when compared to January 2023 (12) new land listings. Regarding demand, both contracted and completed land sales in January 2024, nearly reached their highest monthly totals for the past year. Contracted sales in January 2024 (15), increased by 200% compared to January 2023 (5), while completed sales (11) saw a more modest increase of 22.2% from January 2023 (9). While demand is on the rise, the supply continues to outpace it, resulting in a readily available number of listings for buyers to consider.
The median land sales price in January 2024, continued its declining trend observed over the past six months. Comparing the median land sales price of January 2023 to January 2024, it nearly halved, decreasing by 43.8%. Similarly, the average land sales price for January 2024 experienced a comparable pattern. There's a 46.2% decrease from January 2023 when compared to January 2024.
The median Days on the Market (DOM) for land decreased in January 2024, following its December 2023 surge. January 2024 (128 days) returned to the timeframe observed when compared to the period of January to September 2023, as depicted in the graph. Data also reveals minimal change when comparing January 2023 to January 2024, with less than a 1% change in total days.
Lastly, the average land list/sale price ratio for January 2024, stayed relatively consistent compared to the last two months of 2023. However, examining the year-over-year change from January 2023, this reveals an 8.9% decrease.
Land Market Indicators
New Listings, Contracted Sales & Completed Sales
Average & Median Price
Curious about whatyour home or property is worth now?
We're able to explain what these numbers mean for you and your home's or property's current market value.