Our monthly Market Report provides meaningful and valuable information, to empower buyers and sellers who are considering a real estate transaction in Nassau or Paradise Island (Bahamas).
If you're considering selling your property or buying property on Nassau or Paradise Island, it's essential to understand what's happening in The Bahamas' real estate market. Knowing the most important data, such as median and average prices, the number of properties sold, the number of new listings, and the days on the market will better prepare you for selling or buying.
We are happy to share our July 2024 analysis of the Nassau and Paradise Island market. We also encourage you to review our quarterly market reports on Abaco, Eleuthera, Exuma, Grand Bahama and New Providence.
Our market reports provide Morley's interpretation of the data from the Bahamas Real Estate Association MLS. Even though the MLS does not include all real estate sales and related real estate data, we believe the MLS data is reasonable and consistent to be reliable to use to estimate local real estate trends.

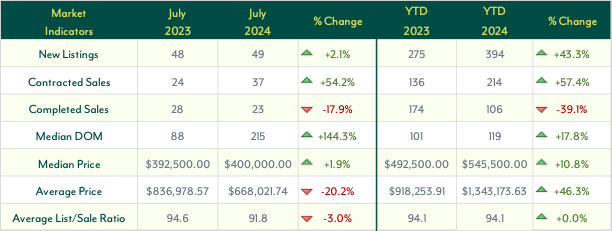
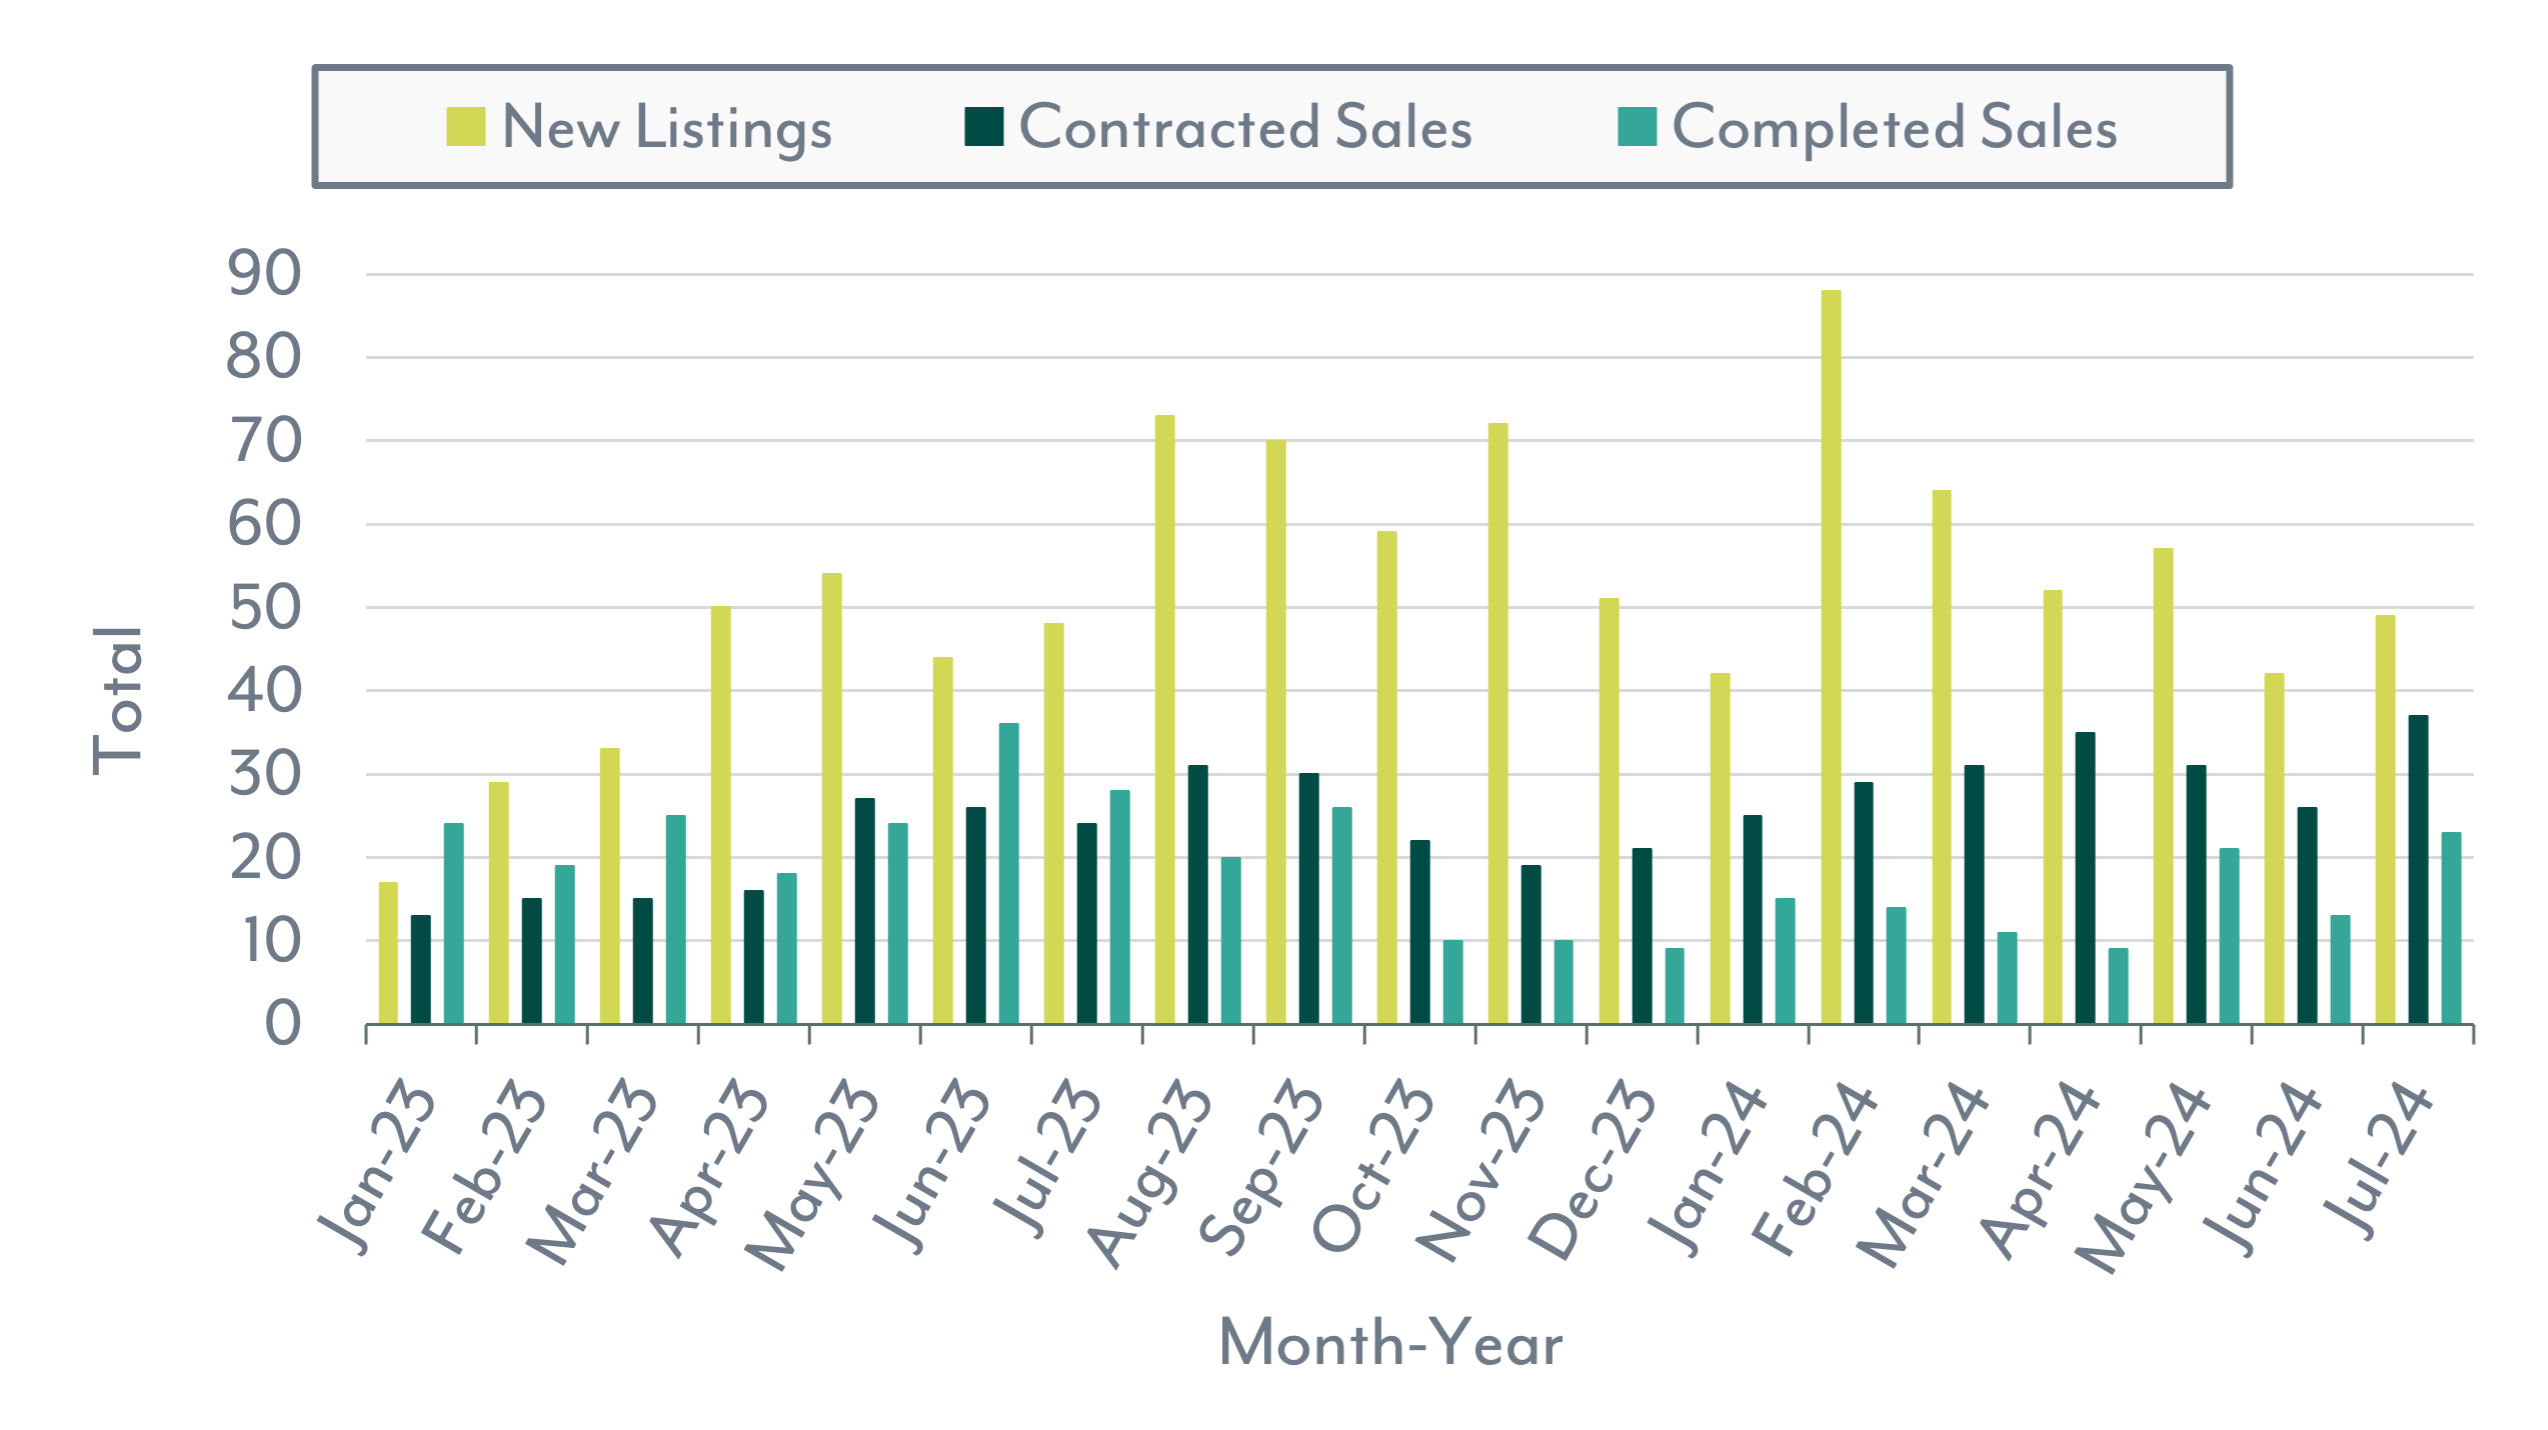
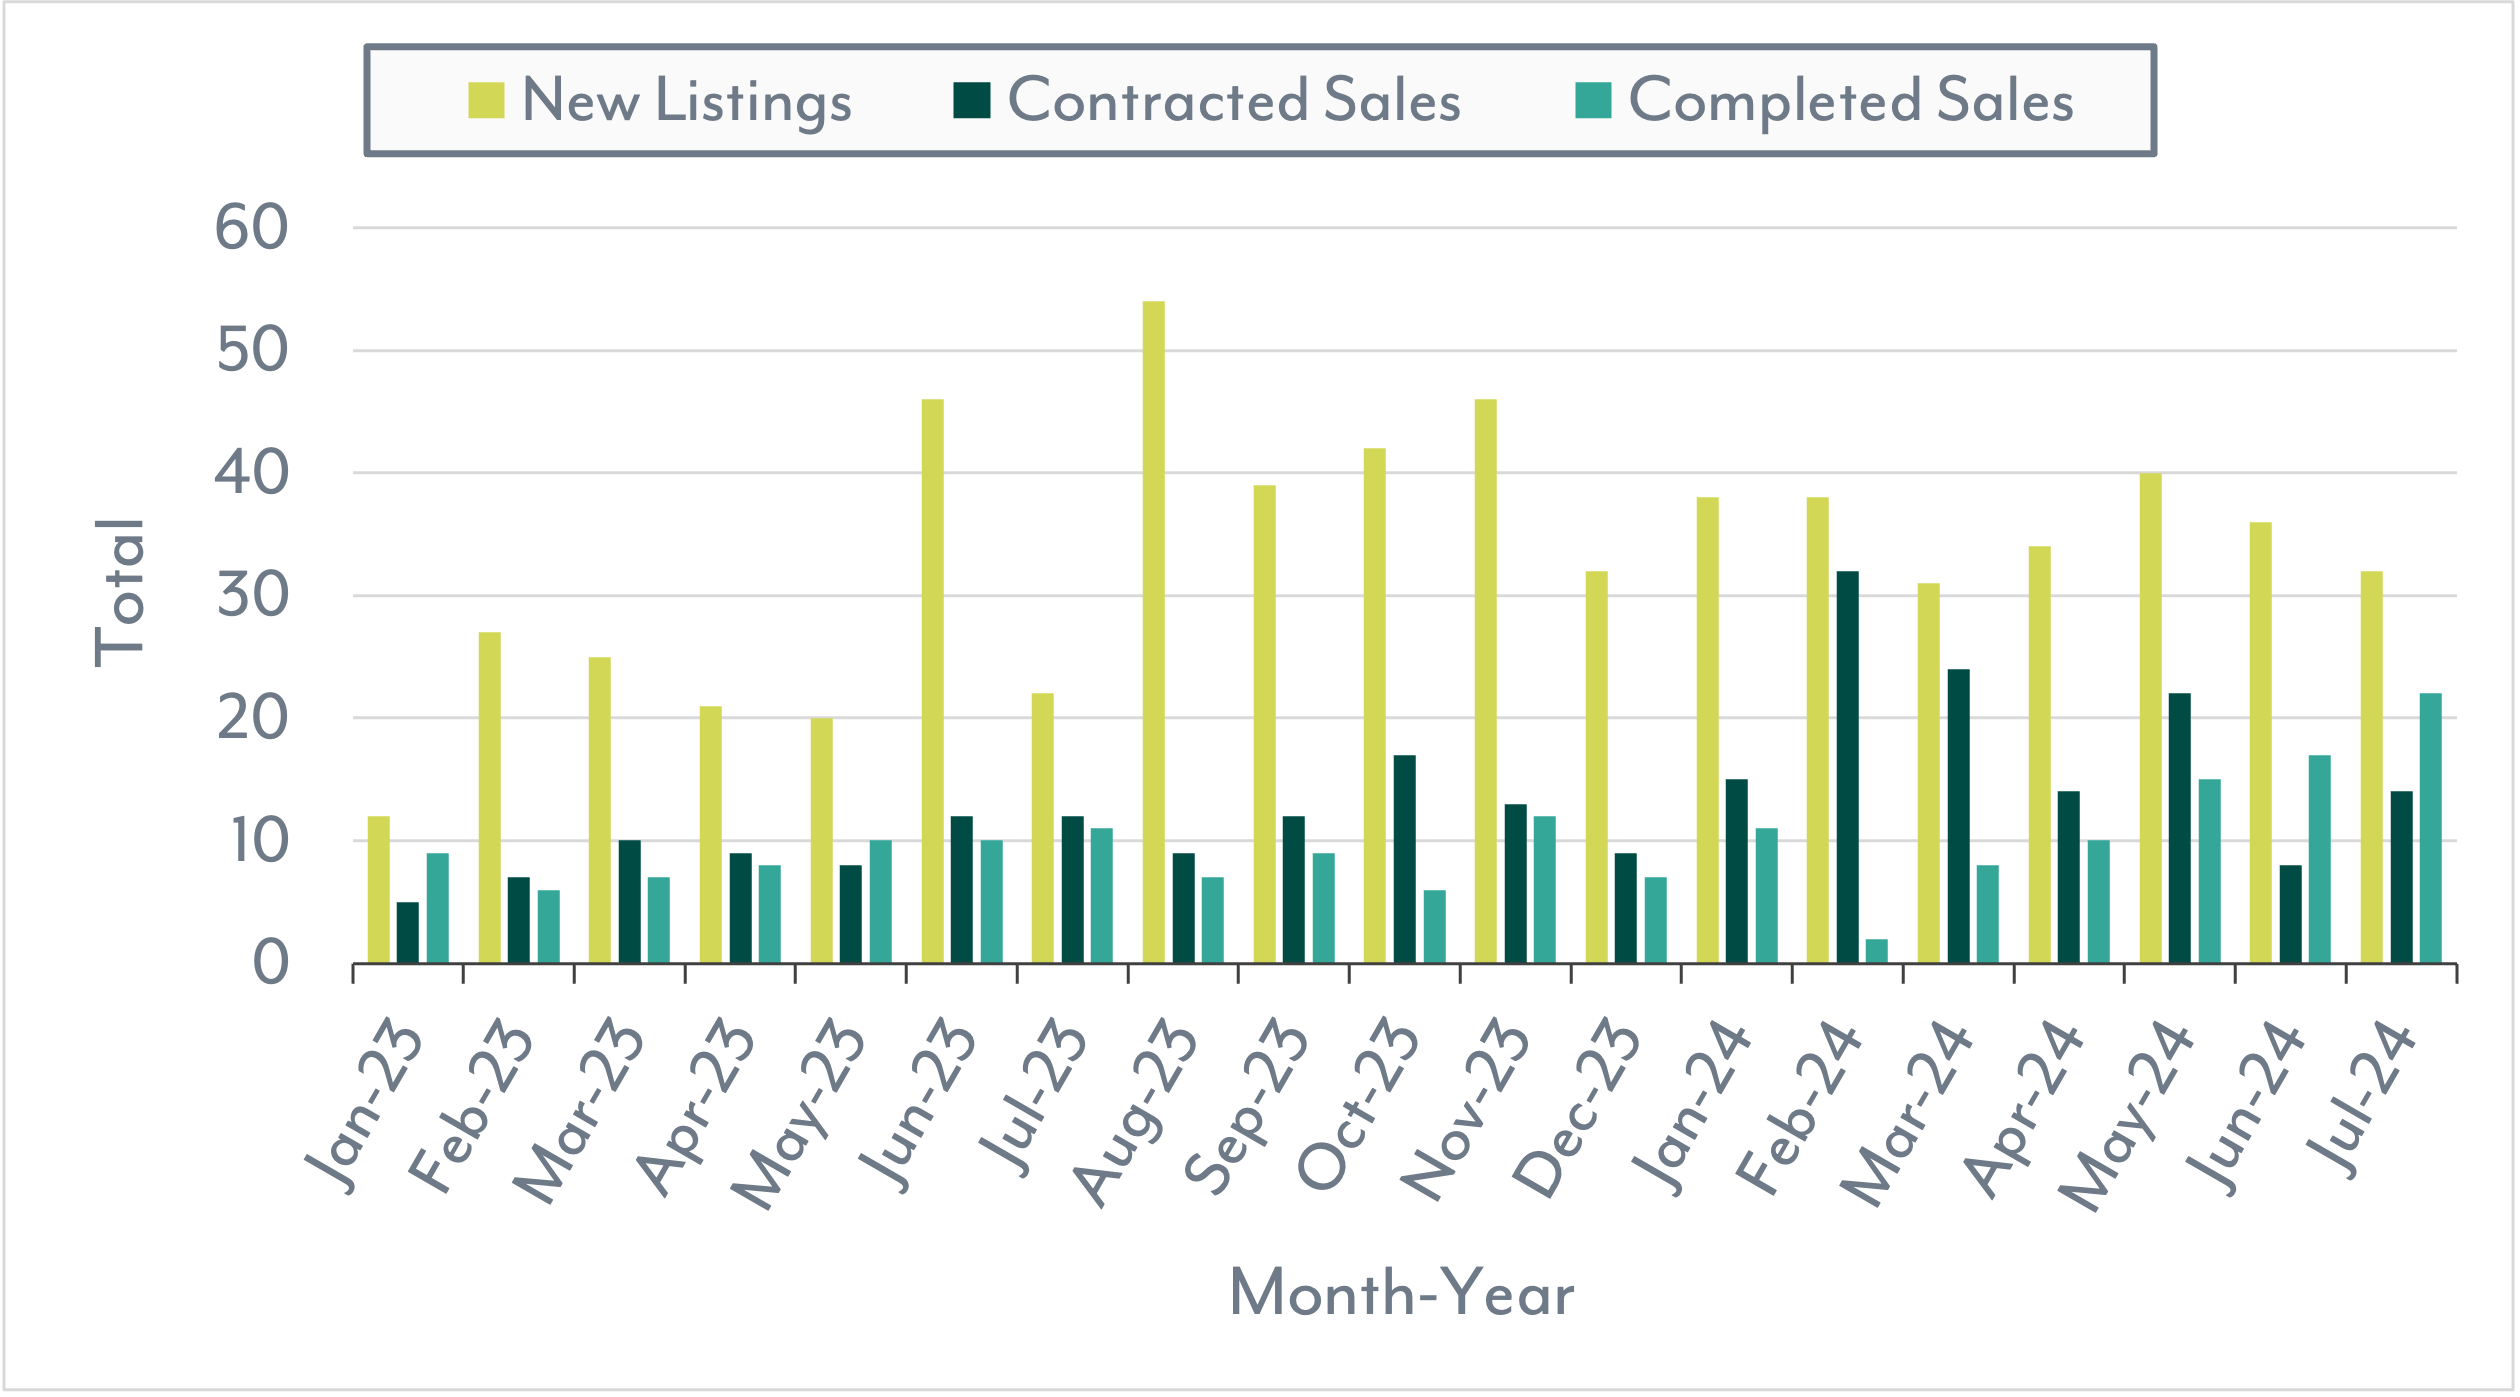
The Nassau and Paradise Island housing market so far this year has continued to grow in demand, but the inventory of homes has started to shrink. While there might be a smaller inventory during this past month, the volume of New Listings has increased by 2.1% from July 2023 and is up 43.3% year-to-date (YTD) compared to 2023.
Similar to New Listings, the volume of Contracted Sales has also experienced increases. Year-over-year (YoY), Contracted Sales increased by 54.2% in July 2024, and YTD, this volume increased by 57.4%.
Contrary to previous trends, the number of Completed Sales in July 2024 decreased by 17.9% compared to the same month last year and by 39.1% YTD. Despite these declines, July recorded the highest volume of Completed Sales for 2024. Although demand may have been slightly higher in 2023, the data suggests we are beginning to see an increase in sales volume.
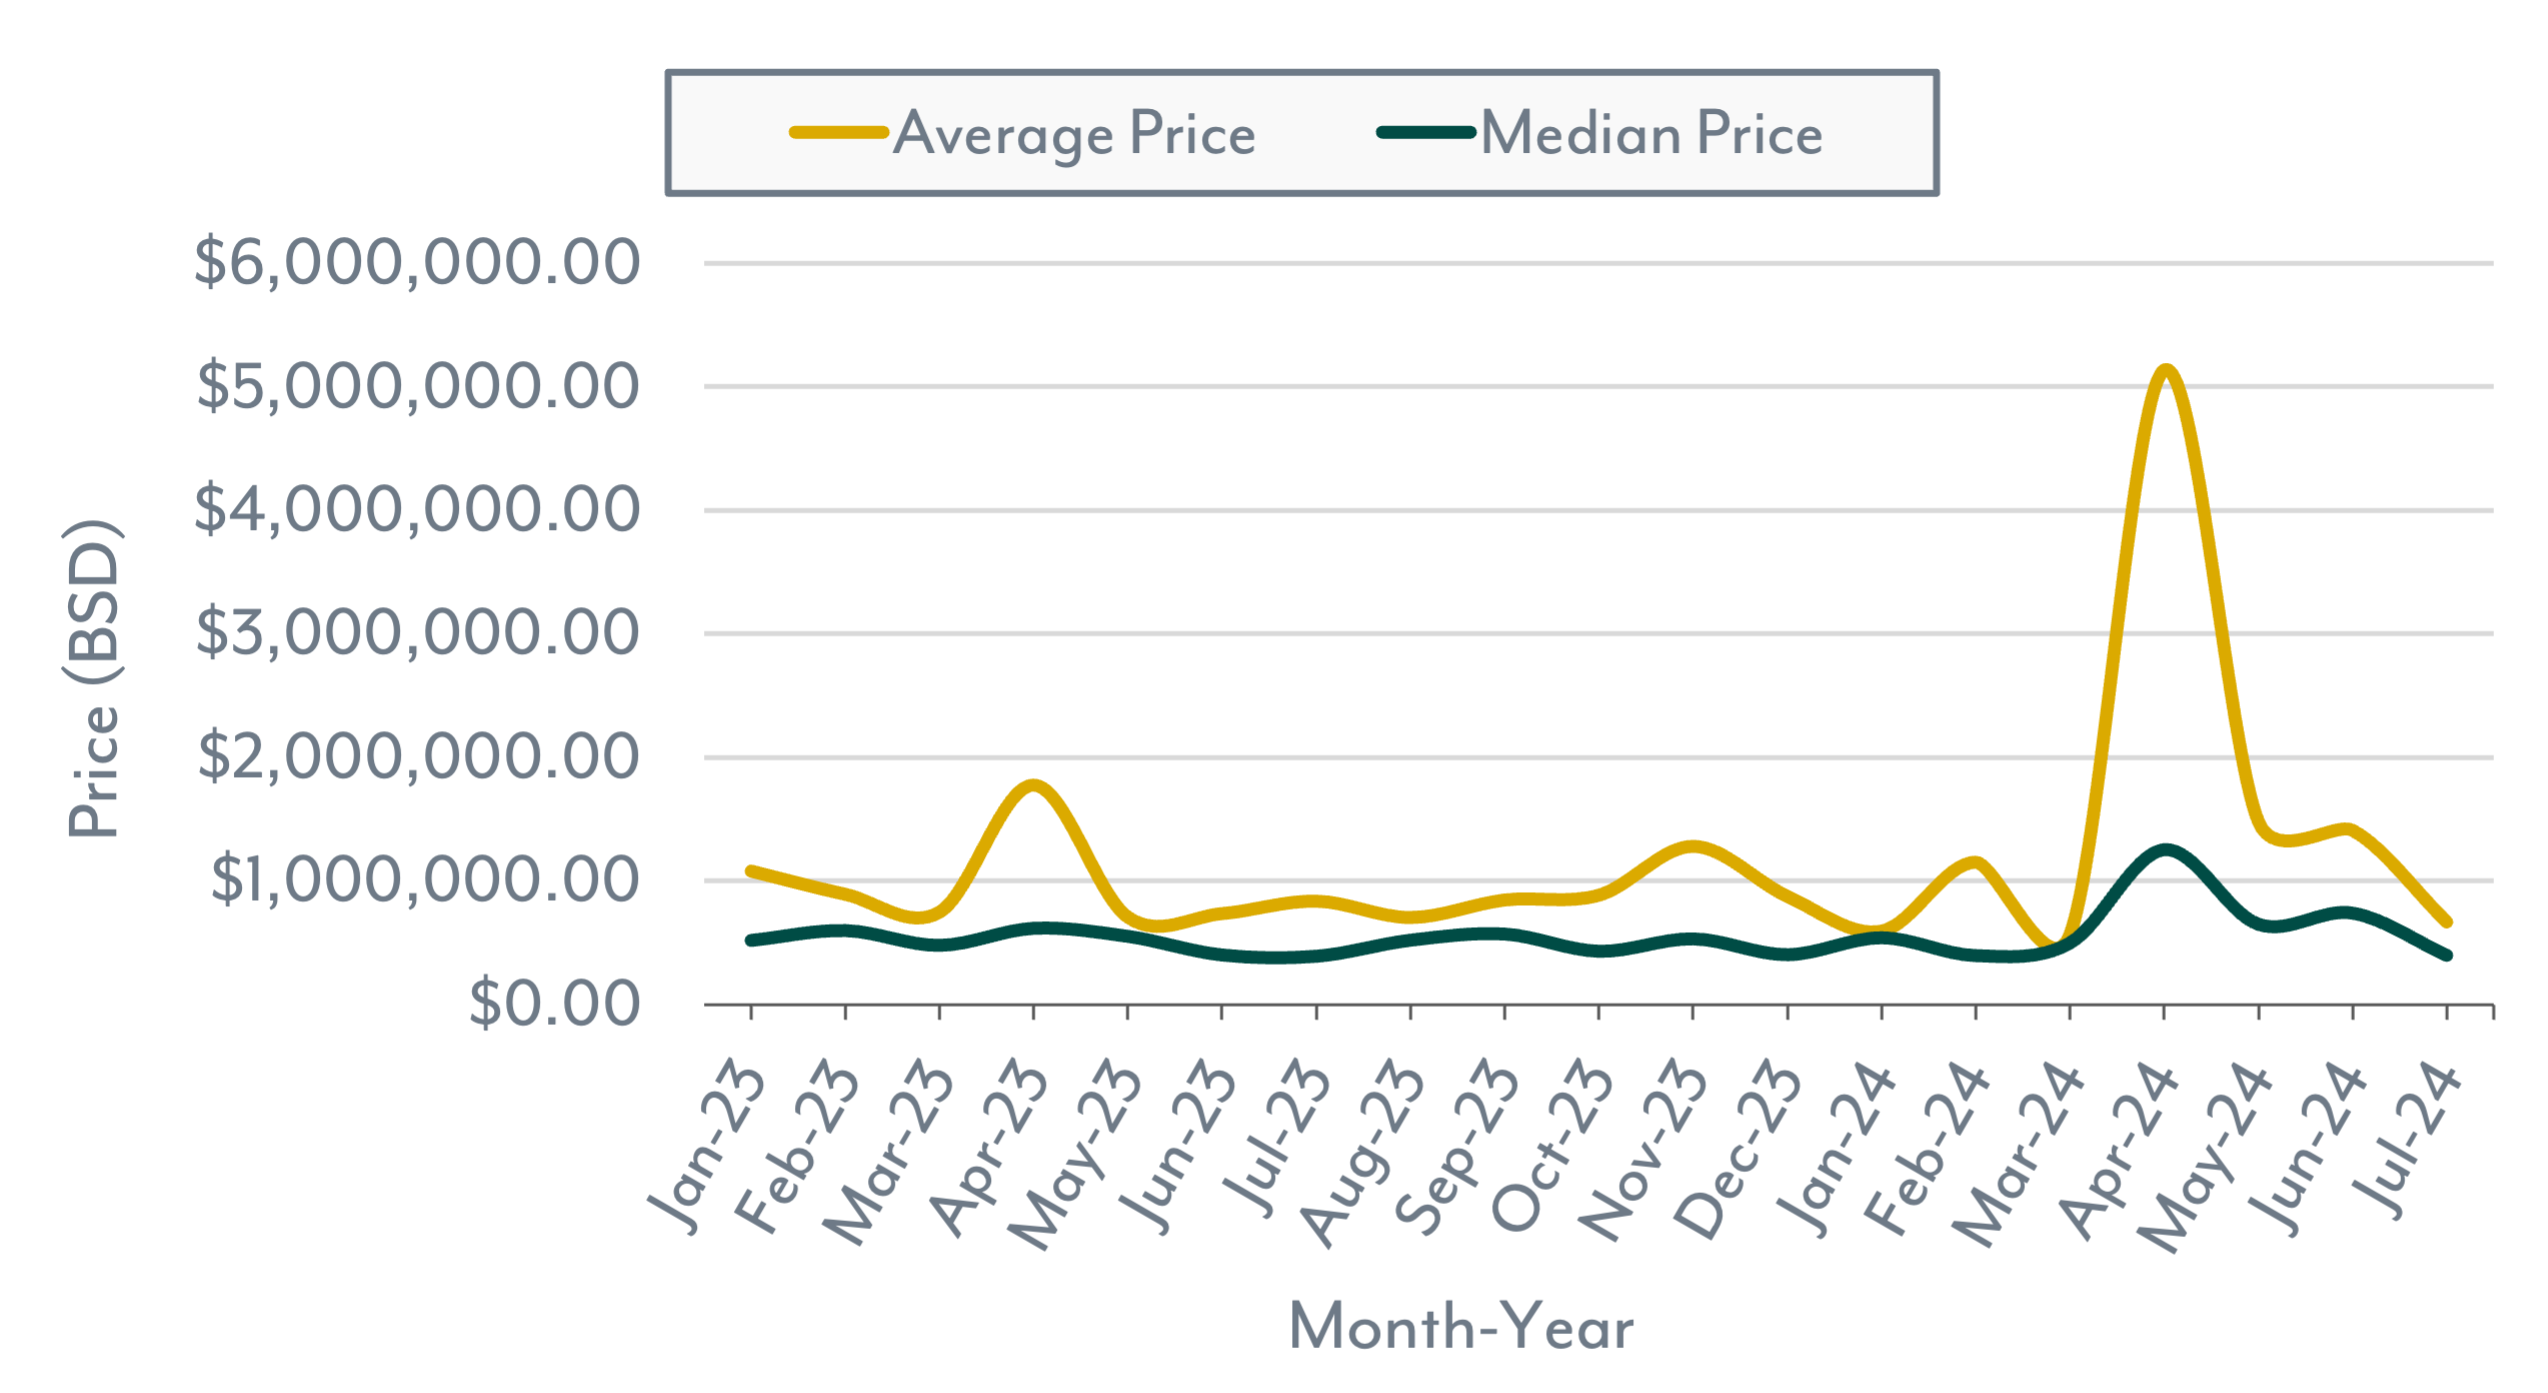
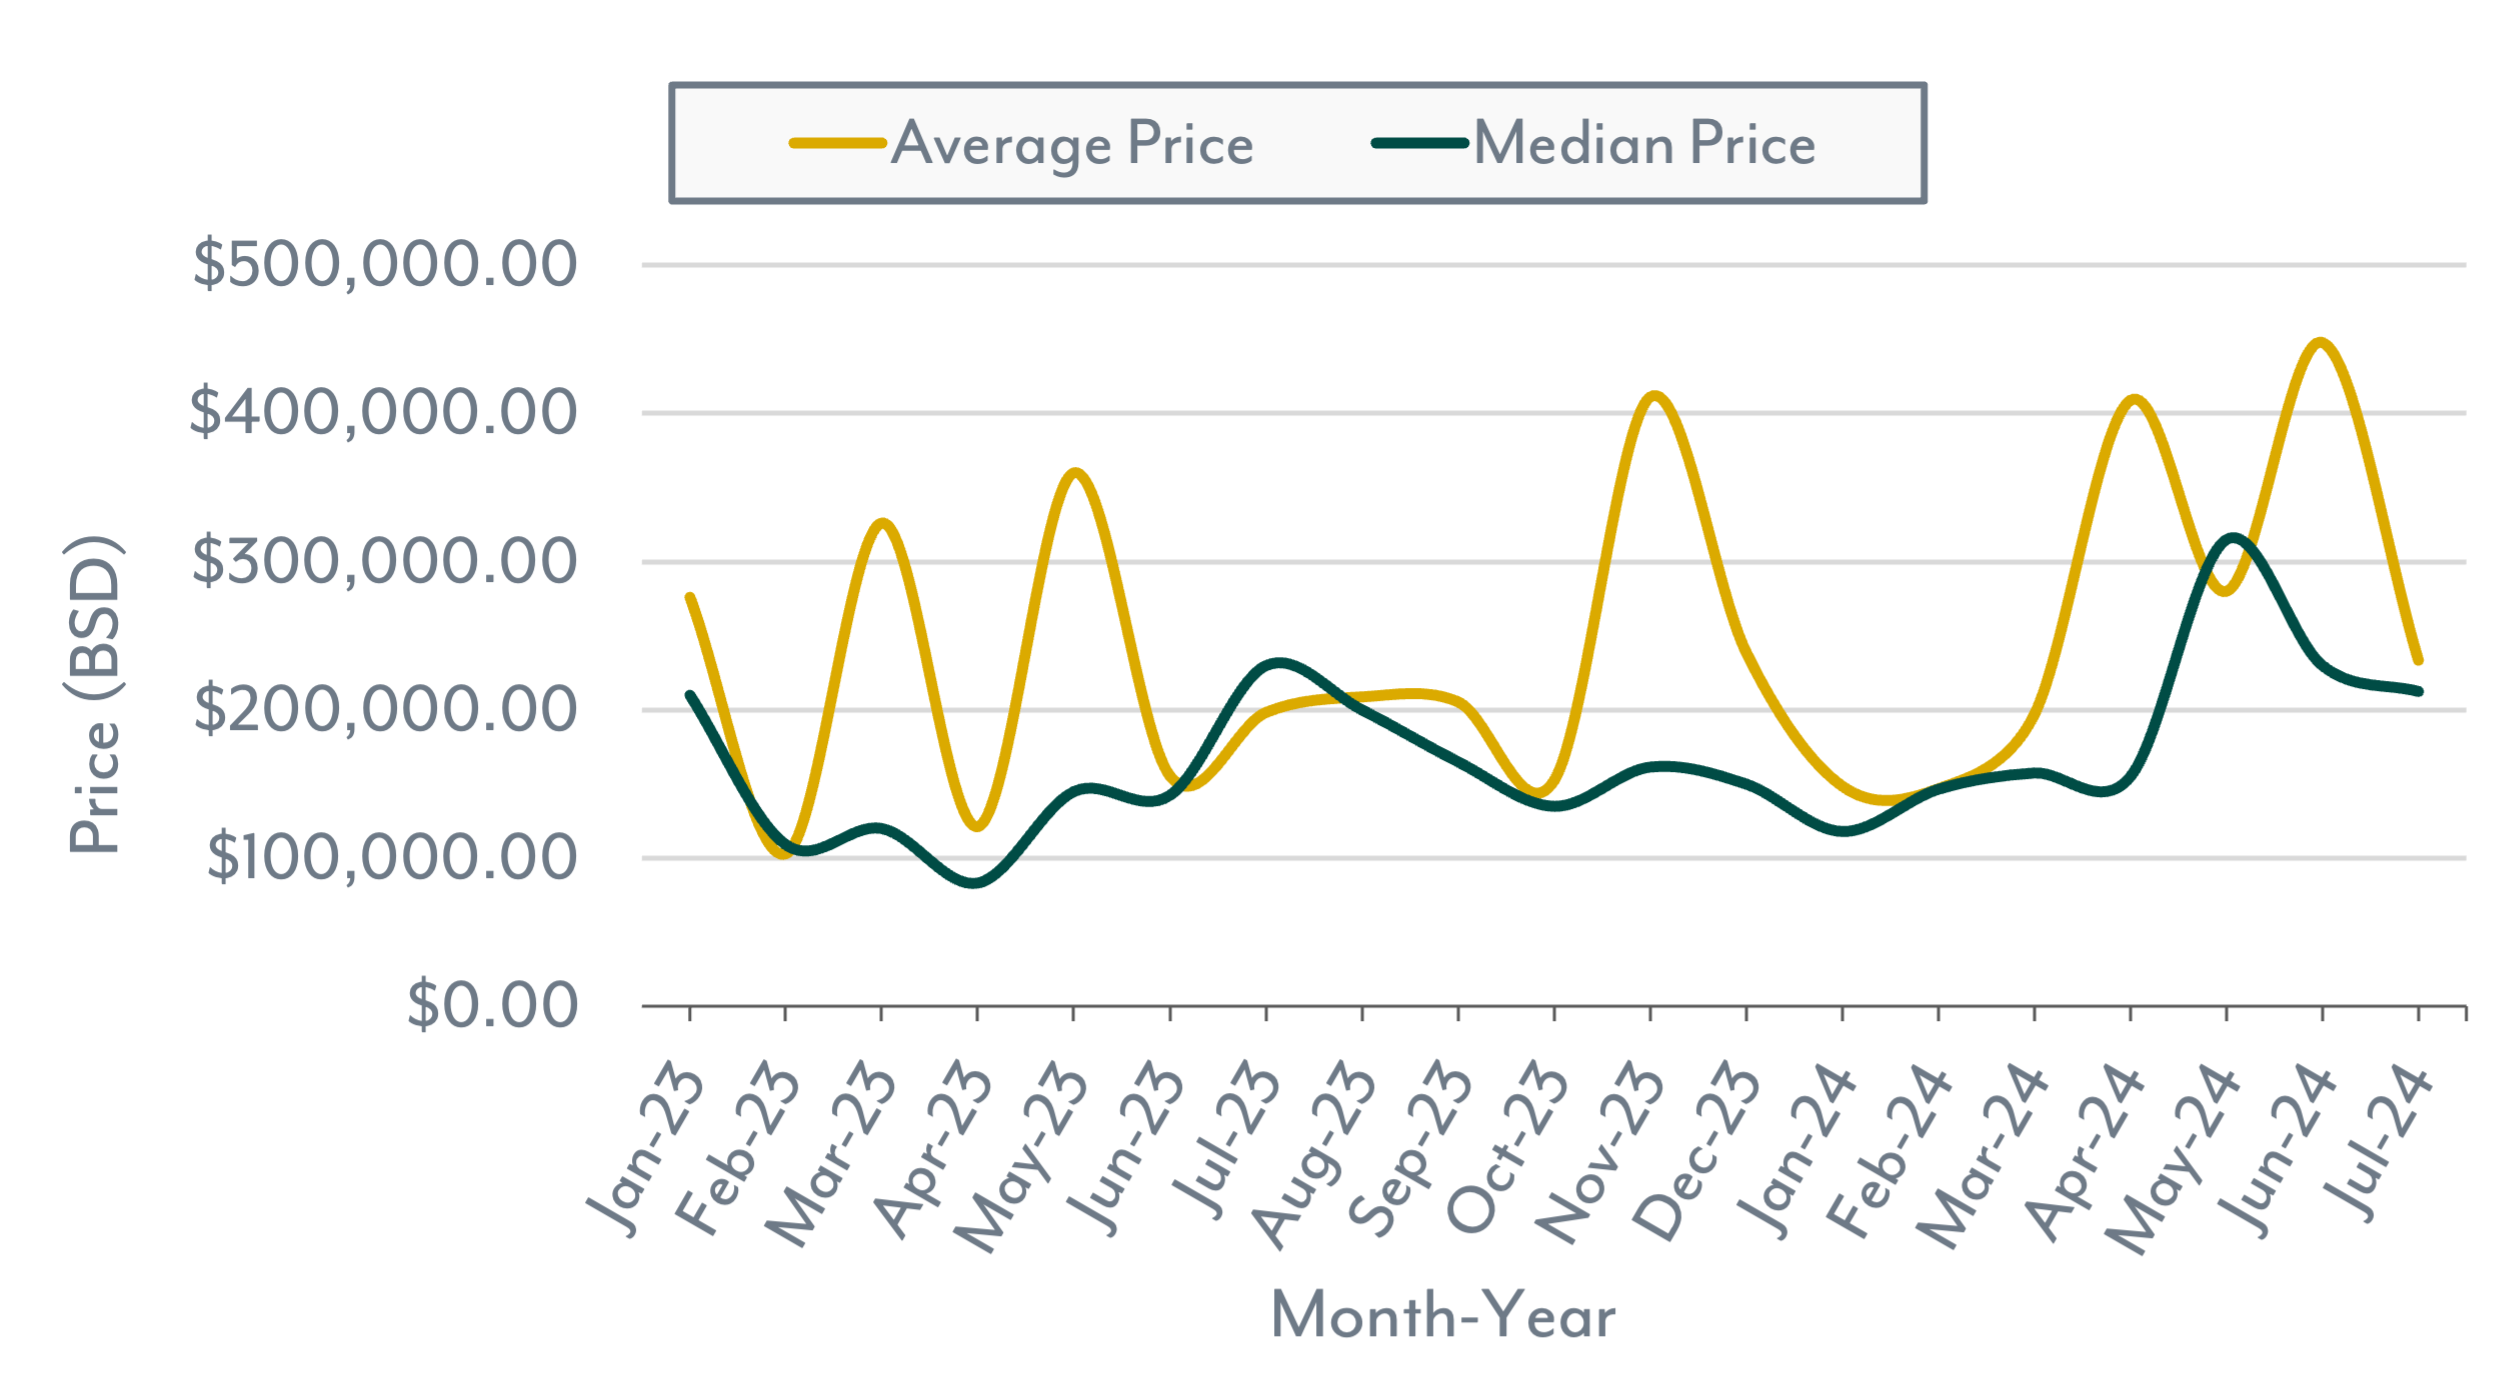
Home prices in this market are returning to a normal range after a period of elevated prices. YoY, the Median Price rose by 1.9%, while the Average Price fell by 20.2%. However, YTD comparisons reveal more significant changes, with the Median Price up 10.8% and the Average Price up 46.3%.
The median Days on the Market (DOM) significantly increased, with July being the longest period in 2024. Compared to the previous year, homes in Nassau took 144.3% longer to sell than in July 2023. However, YTD comparisons offer a more accurate view of the market due to a larger sample size. YTD, the DOM for homes sold in Nassau increased by 17.8%.
Lastly, the Average List-To-Sale Price Ratio experienced a slight decline but remained within the normal range for this market. YoY, there was a 3.0% decrease, indicating that sellers in July 2024 were slightly more flexible with pricing compared to July 2023. However, YTD comparisons show no change (0.0%) when comparing 2024 to 2023.
Home Market Indicators
New Listings, Contracted Sales & Completed Sales
Average & Median Price

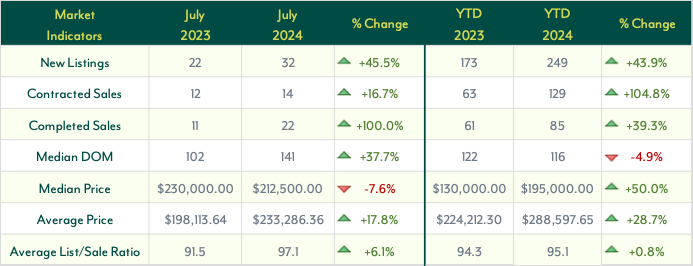
The Nassau and Paradise Island market for land has seen significant changes recently, with notable increases in activity. The volume of New Listings rose by 45.5% year-over-year (YoY) and by 43.9% year-to-date (YTD). Despite these gains, the market has maintained a consistent level of new listings since the start of 2024.
Both Contracted and Completed Sales have also shown strong growth. Contracted Sales increased by 16.7% YoY from June 2023 and surged by 104.8% YTD. This means that the number of Contracted Sales in 2024 has more than doubled compared to the same period in 2023. Completed Sales in July 2024 also saw a significant rise, with volumes doubling from July 2023. On a YTD basis, Completed Sales increased by 39.3%.
The data, as illustrated in the graph and Market Indicator table, indicates a gradual upward trend in land prices. The Median Sales Price, while down 7.6% YoY, has seen a substantial 50% increase YTD, suggesting a robust recovery. The Average Sales Price reflects this trend, with a 17.8% YoY increase and a 28.7% rise YTD.
In July 2024, the Days on Market (DOM) for land remained consistent with the market’s midpoint. Compared to July 2023, there was a 37.7% increase in the time it took for properties to sell, indicating a slight slowdown. However, YTD comparisons offer a clearer perspective, showing that land spent 4.9% less time on the market in 2024 compared to the previous year.
Lastly, the Average List-To-Sale Price Ratio in July 2024 stayed relatively high, reflecting firm pricing strategies among sellers. YoY, there was a 6.1% increase, signaling limited flexibility in sale prices. However, on a YTD basis, the increase was a modest 0.8%.
Land Market Indicators
New Listings, Contracted Sales & Completed Sales
Average & Median Price
Not sure if you are ready to buy or sell?
We're able to explain what these numbers mean for you and better guide you to make an informed decision that is best for you based on the current market conditions.



.png)

