Our monthly Market Report provides meaningful and valuable information, to empower buyers and sellers who are considering a real estate transaction in Nassau or Paradise Island (Bahamas).
If you're considering selling your property or buying property on Nassau or Paradise Island, it's essential to understand what's happening in The Bahamas' real estate market. Knowing the most important data, such as median and average prices, the number of properties sold, the number of new listings, and the days on the market will better prepare you for selling or buying.
We are happy to share our March 2024 analysis of the Nassau and Paradise Island market. We also encourage you to review our quarterly market reports on Abaco, Eleuthera, Exuma, Grand Bahama and New Providence.
Our market reports provide Morley's interpretation of the data from the Bahamas Real Estate Association MLS. Even though the MLS does not include all real estate sales and related real estate data, we believe the MLS data is reasonable and consistent to be reliable to use to estimate local real estate trends.

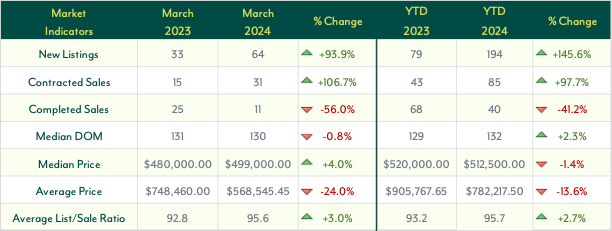
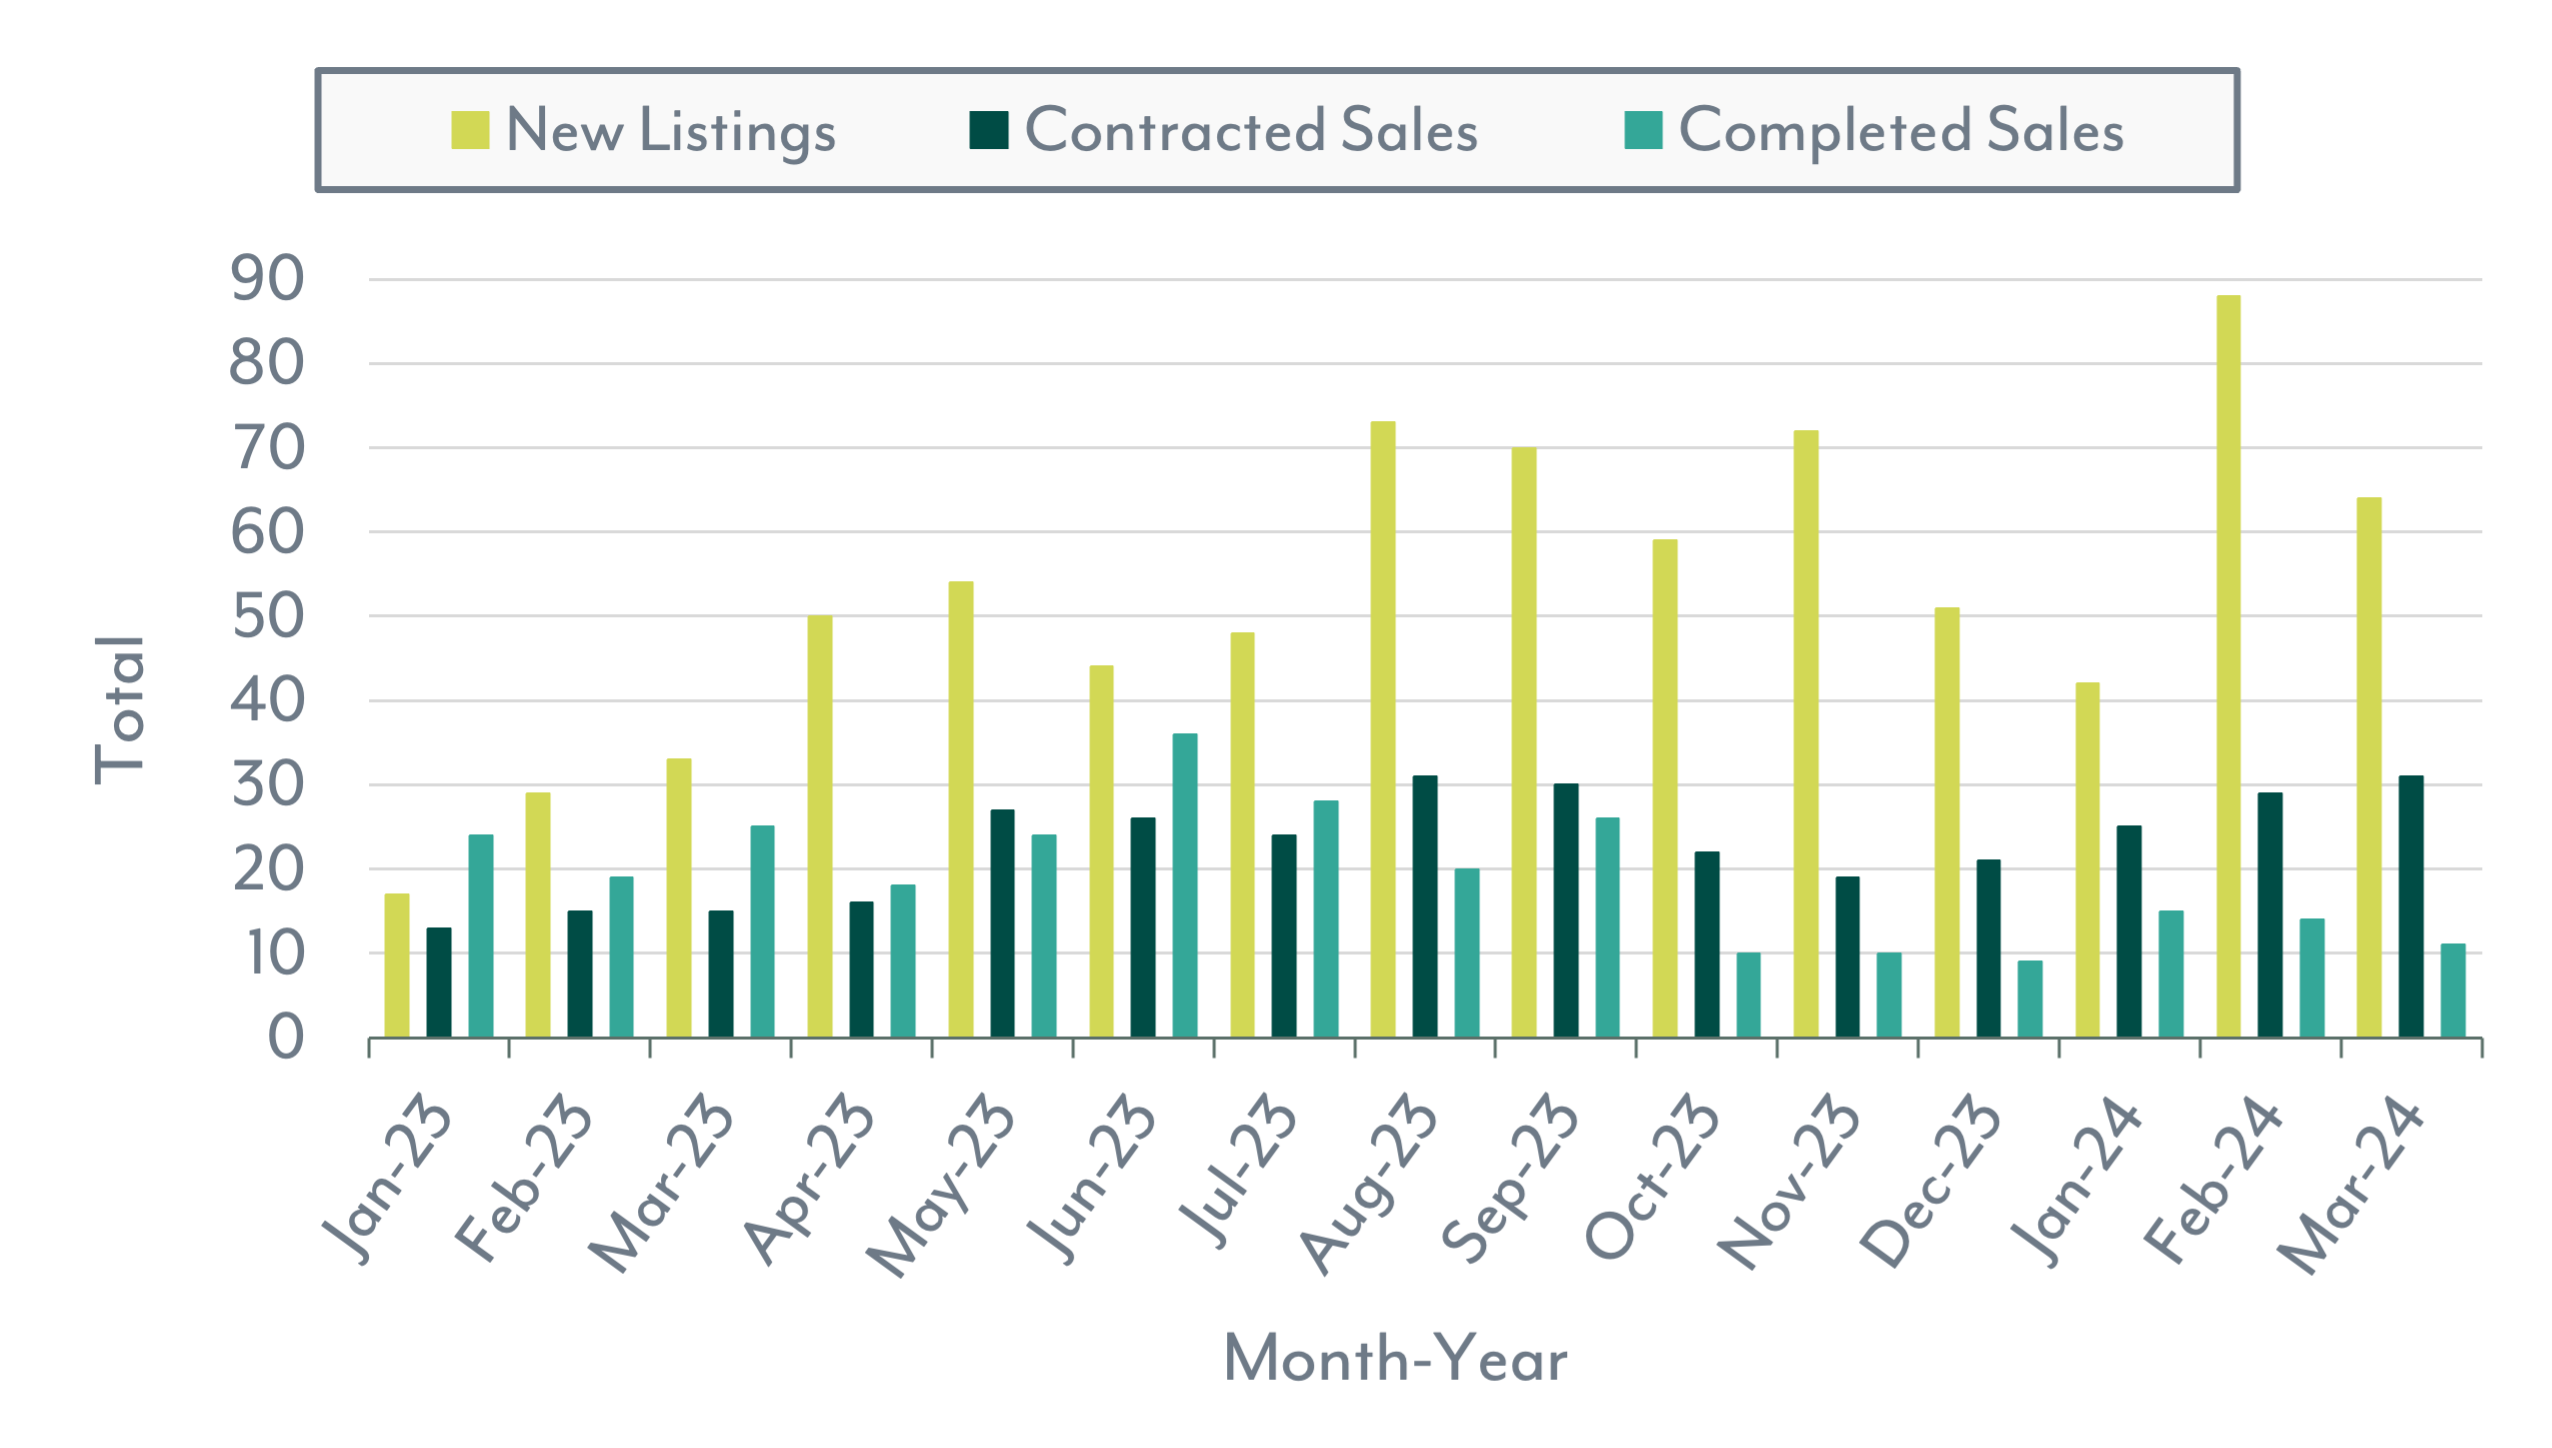
The Nassau and Paradise Island housing market has been pretty consistent over the last six months. One big thing to note is that there are a lot more New Listings of houses now compared to last year. In March 2024, there's been a 93.9% increase in New Listings of houses compared to March 2023. YTD-2024 shows 145.6% more New Listings of houses over last year for the same period, thereby increasing the inventory of available houses and giving more options for buyers.
It's not just more houses being listed; more houses are also going under contract. We've seen a big 106.7% increase in Contracted Sales of houses compared to last year, and a solid 97.7% increase for the year-to-date. But here's the interesting part: even though more houses are going under contract, the number of Completed Sales has gone down by 56% compared to March 2023, and also down by 41.2% year-to-date.
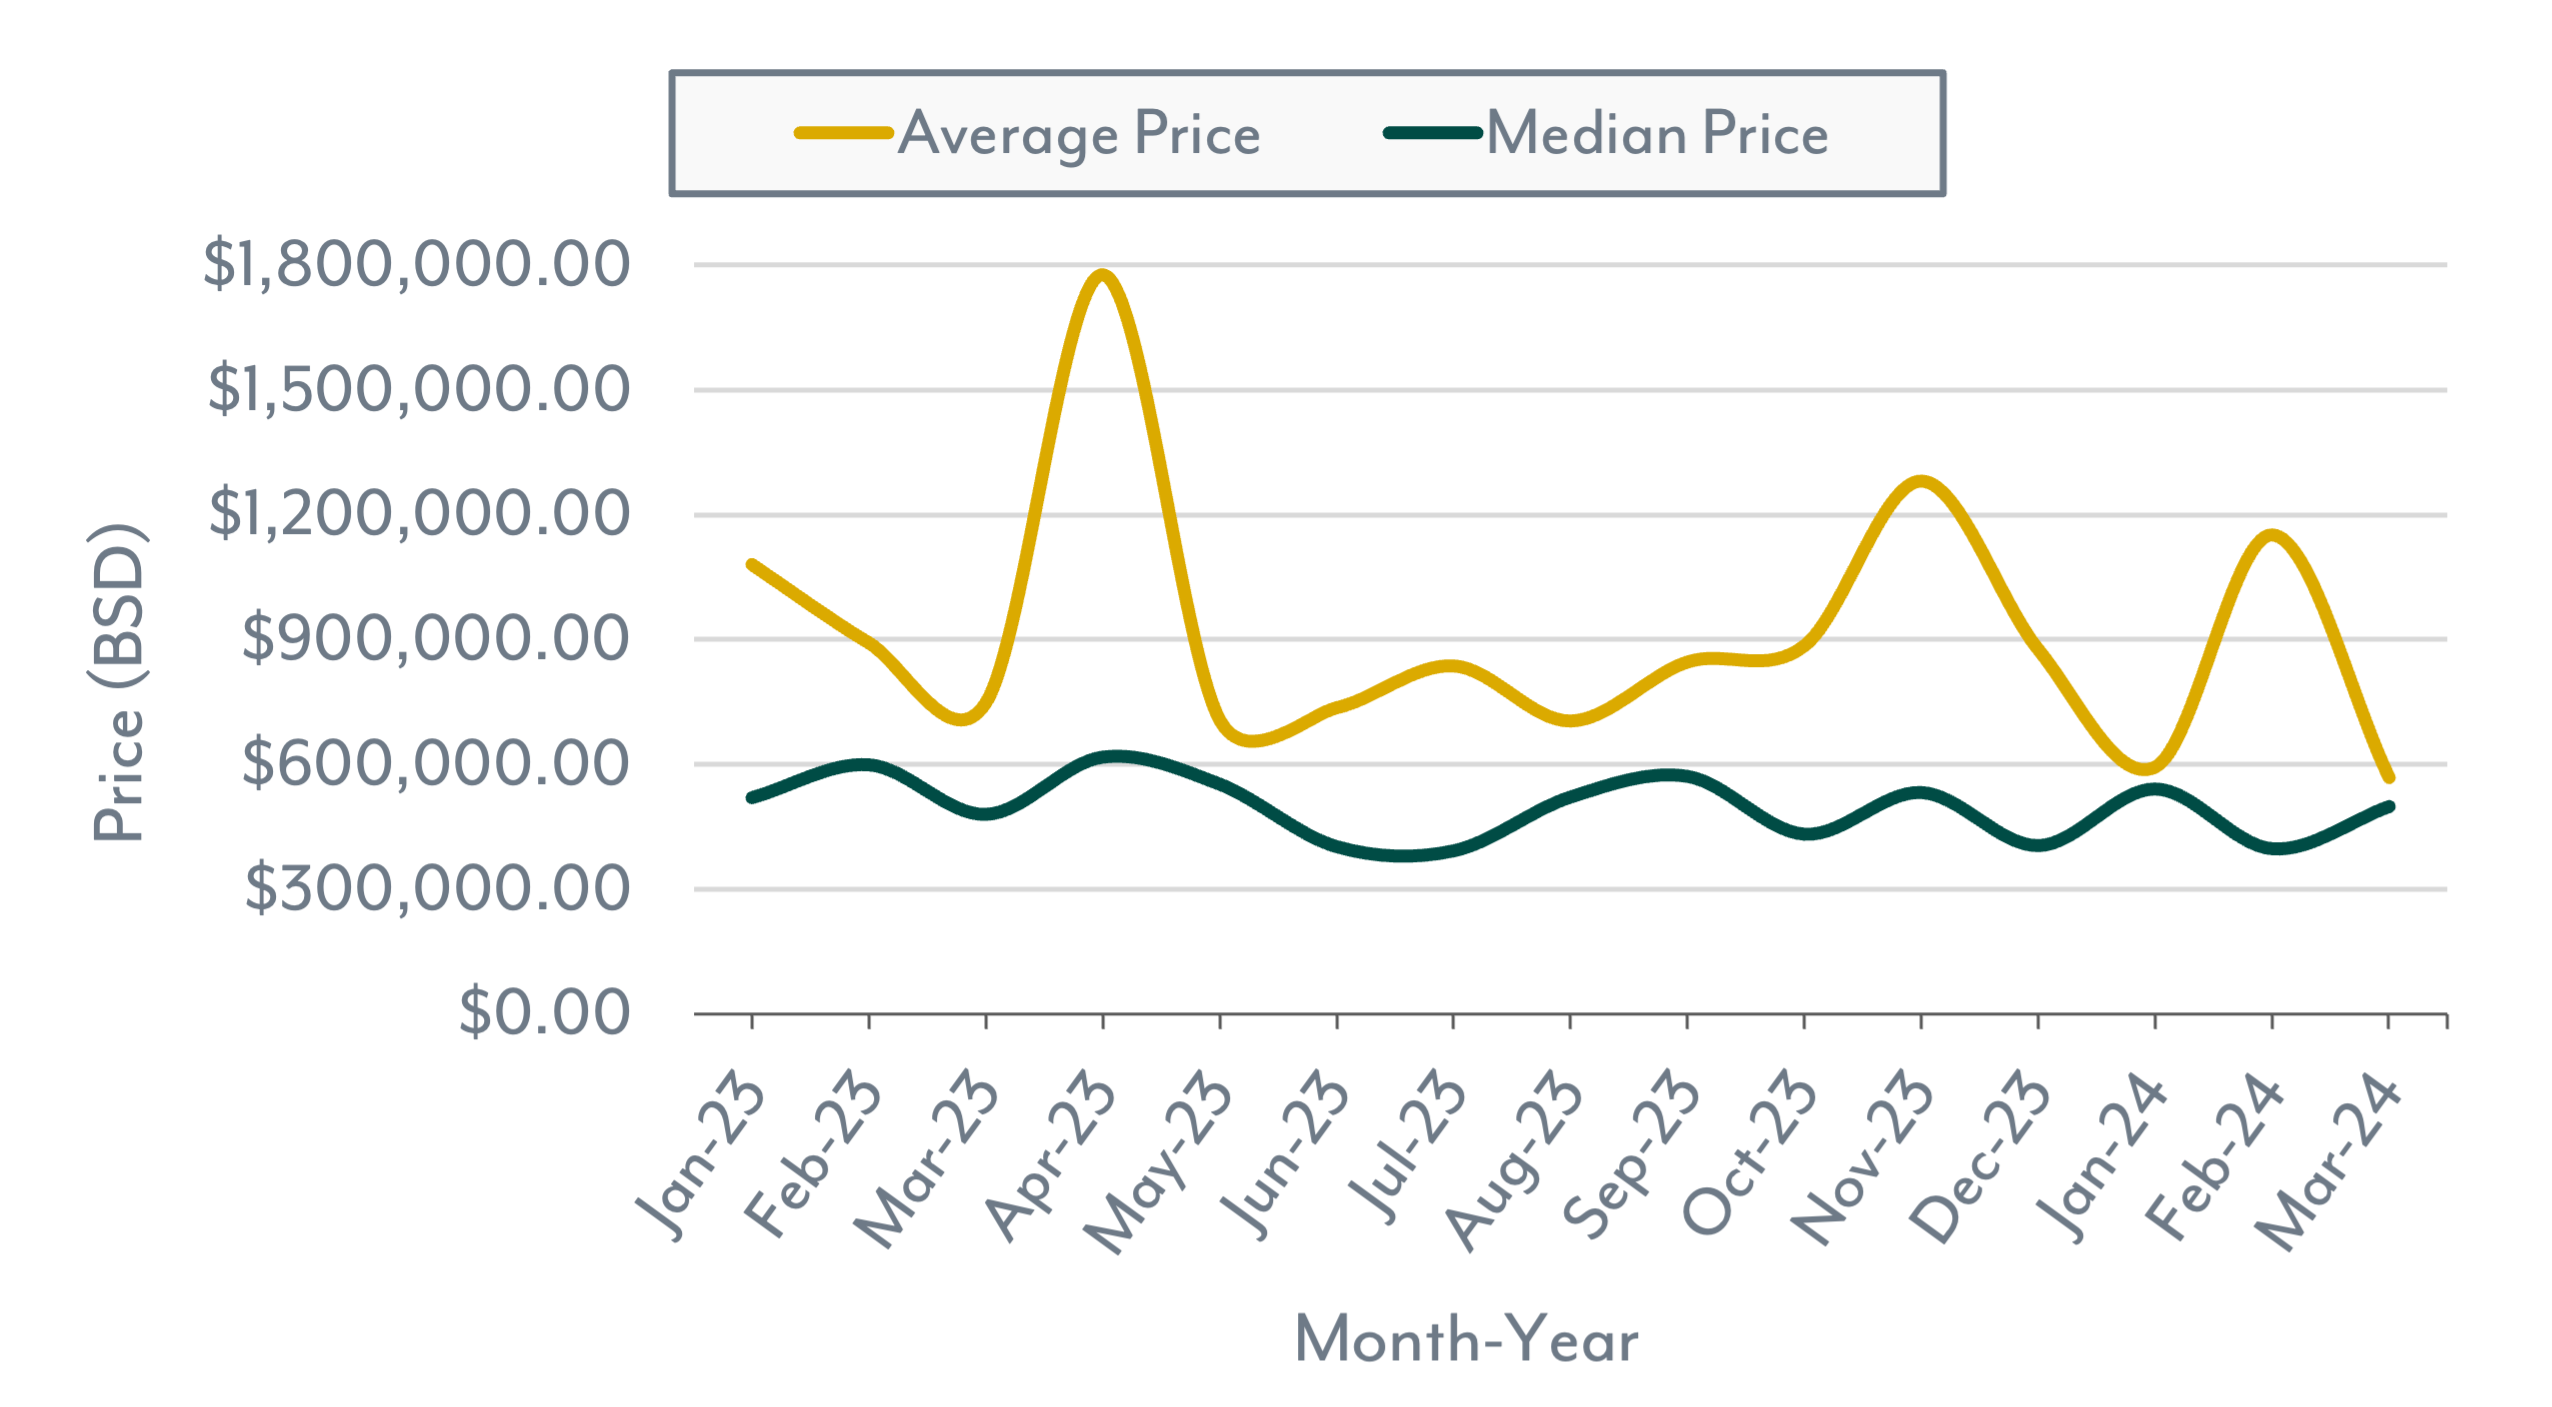
Prices for houses have stayed pretty much the same, with the Median Price hovering between $400,000 to $600,000. There's only been a small 4% increase in the Median Price from March 2023 to March 2024, and for the year-to-date, it's actually gone down by 1.4%. If we look at the Average Price, it has decreased by 24% compared to last March and has also decreased by 13.6% year-to-date.
As for how long houses are on the market, not much has changed. The Median Days On Market (DOM) has only reduced by 0.8% compared to last March, and has increased by 2.3% for the year-to-date. That's just a difference of one and three days, respectively.
Lastly, the Average List/Sale Ratio (price) has stayed pretty consistent throughout Q1 of 2024. It's gone up by about 3% compared to March 2023 and also increased by 2.7% for the year-to-date versus the same period for last year.
So, while a lot is happening in the market, there are some interesting trends worth keeping an eye on.
Home Market Indicators
New Listings, Contracted Sales & Completed Sales
Average & Median Price

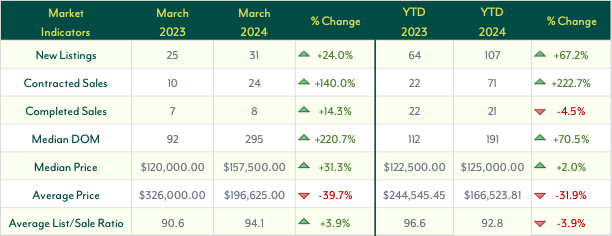
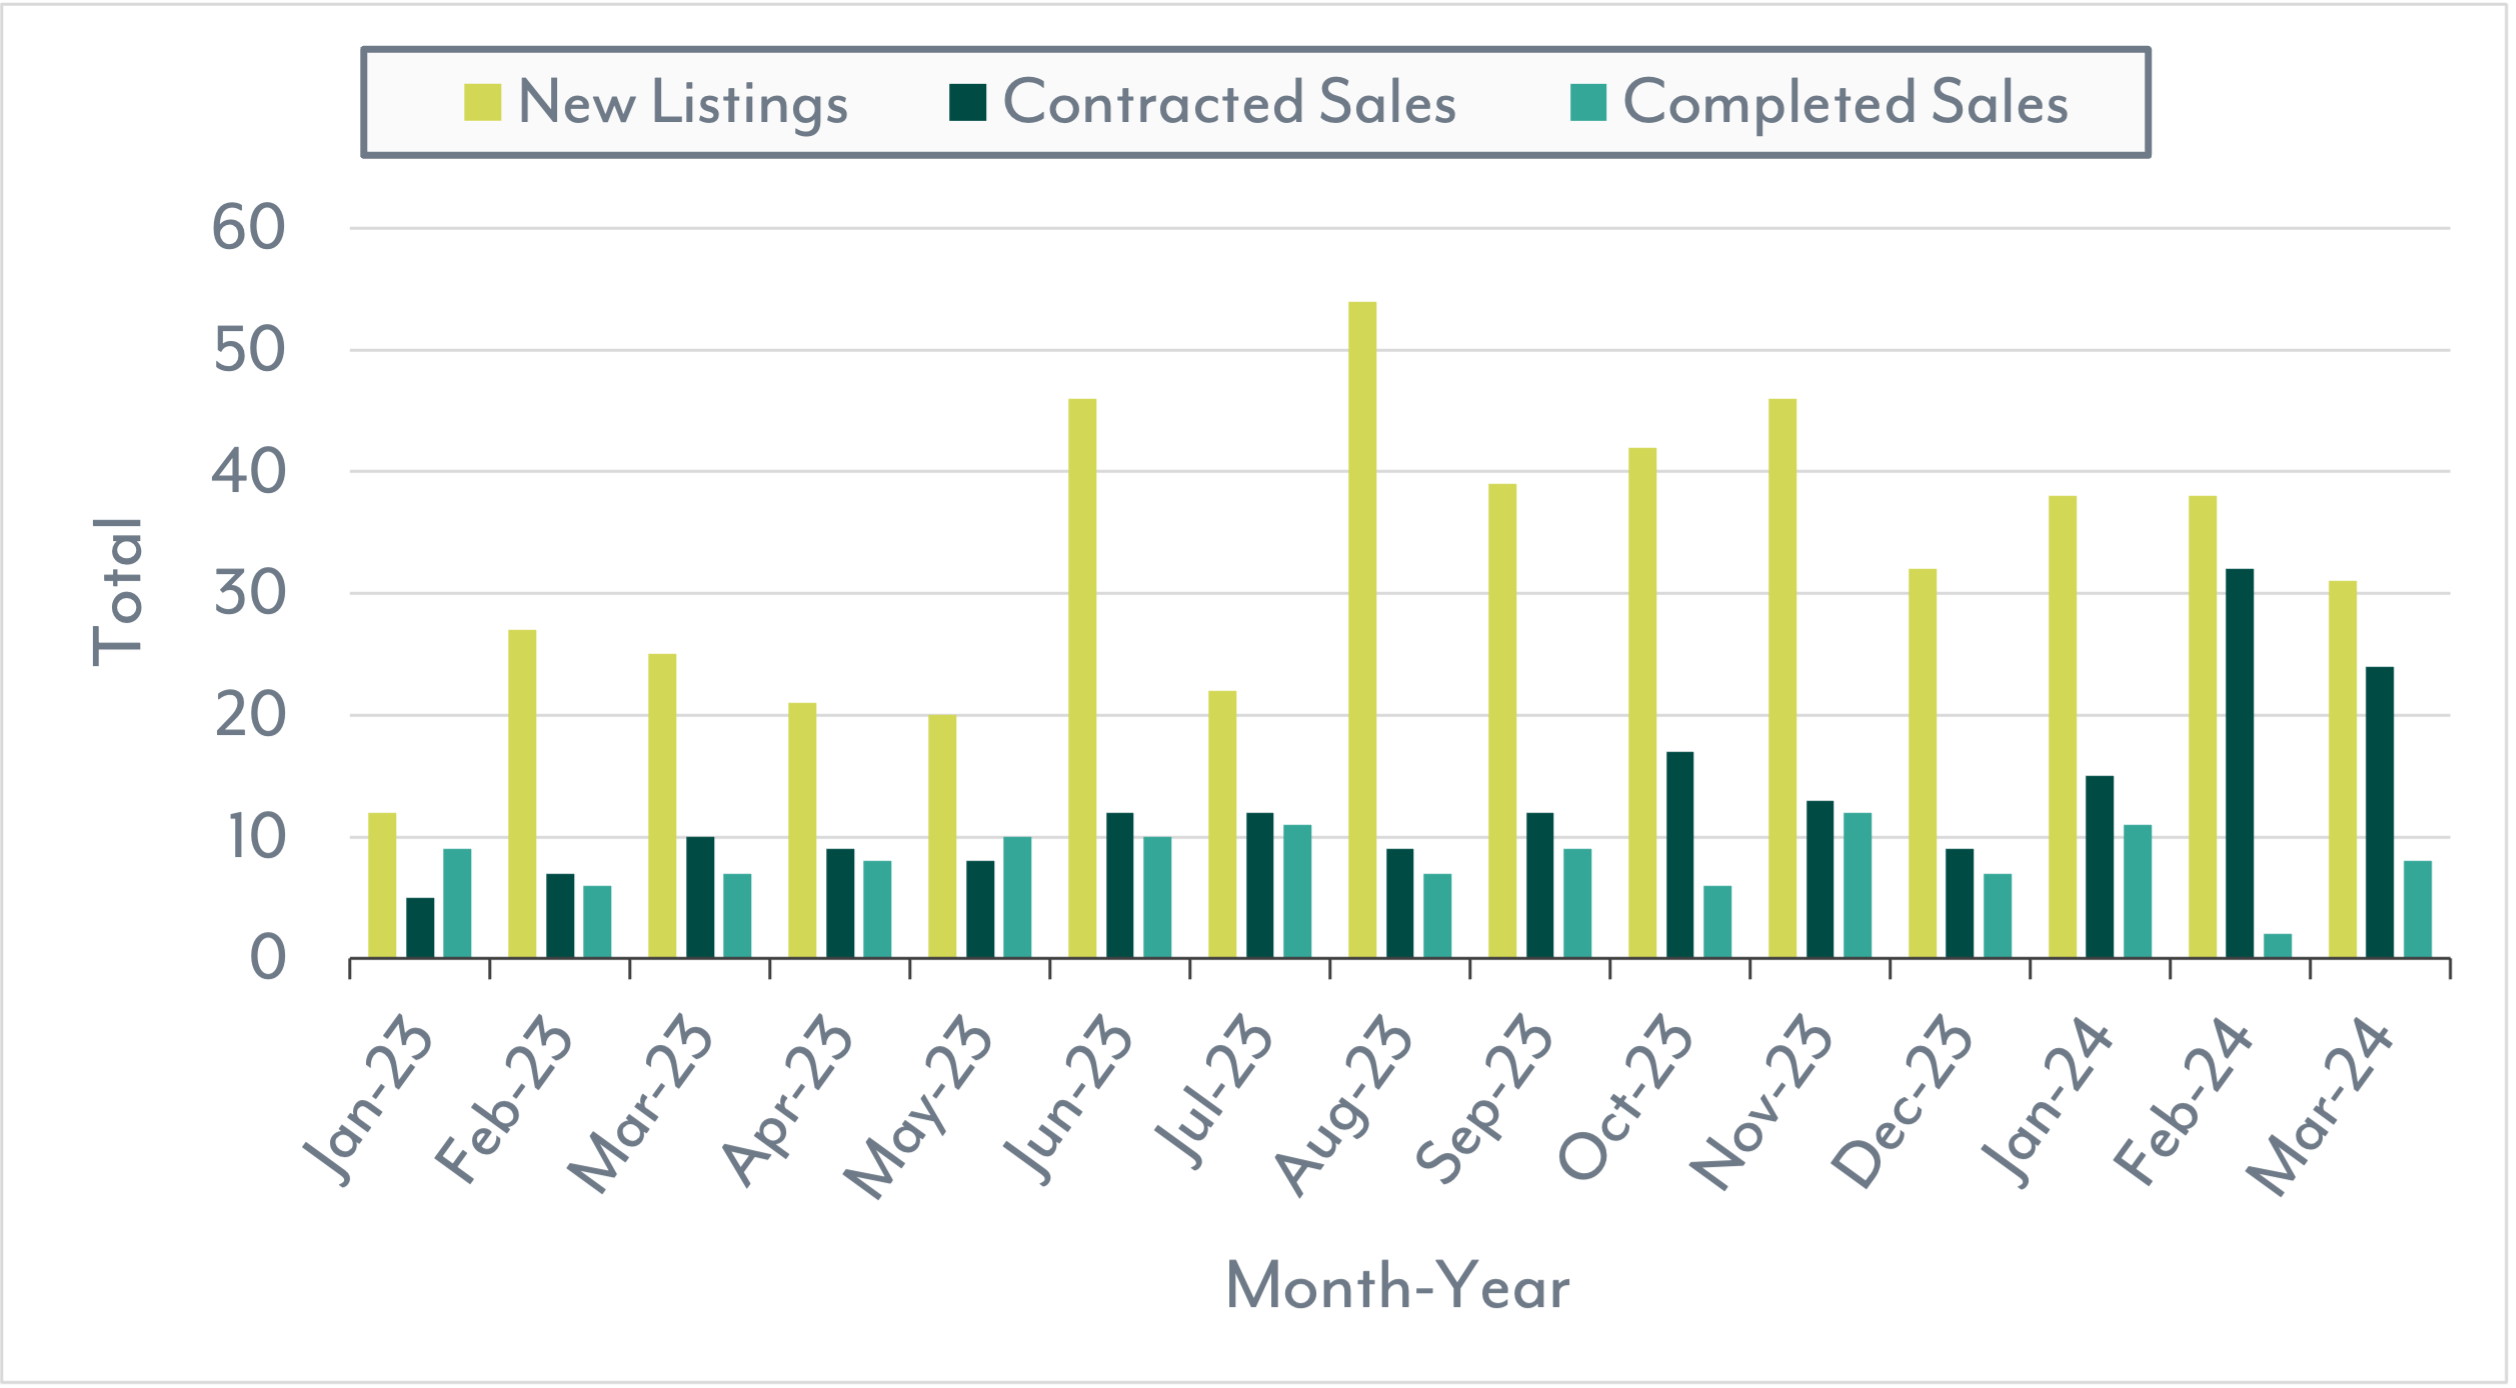
The Nassau and Paradise Island land market, similar to the market for houses, has remained pretty consistent over the last six months. New Listings, reflecting increases both year-over-year (+24%) and year-to-date (+67.2%), but have also been gradually declining monthly over this period. This decline in supply suggests a corresponding uptick in demand. Contracted Sales of land have surged by 140% compared to March 2023 and have risen by 67.2% year-to-date spanning 2023 and 2024. Conversely, Completed Sales of land have exhibited minimal change, remaining relatively consistent over the past two years. March 2024 saw only a 14.3% increase compared to March 2023, while year-to-date figures indicate a 4.5% decrease in volume in Completed Sales.
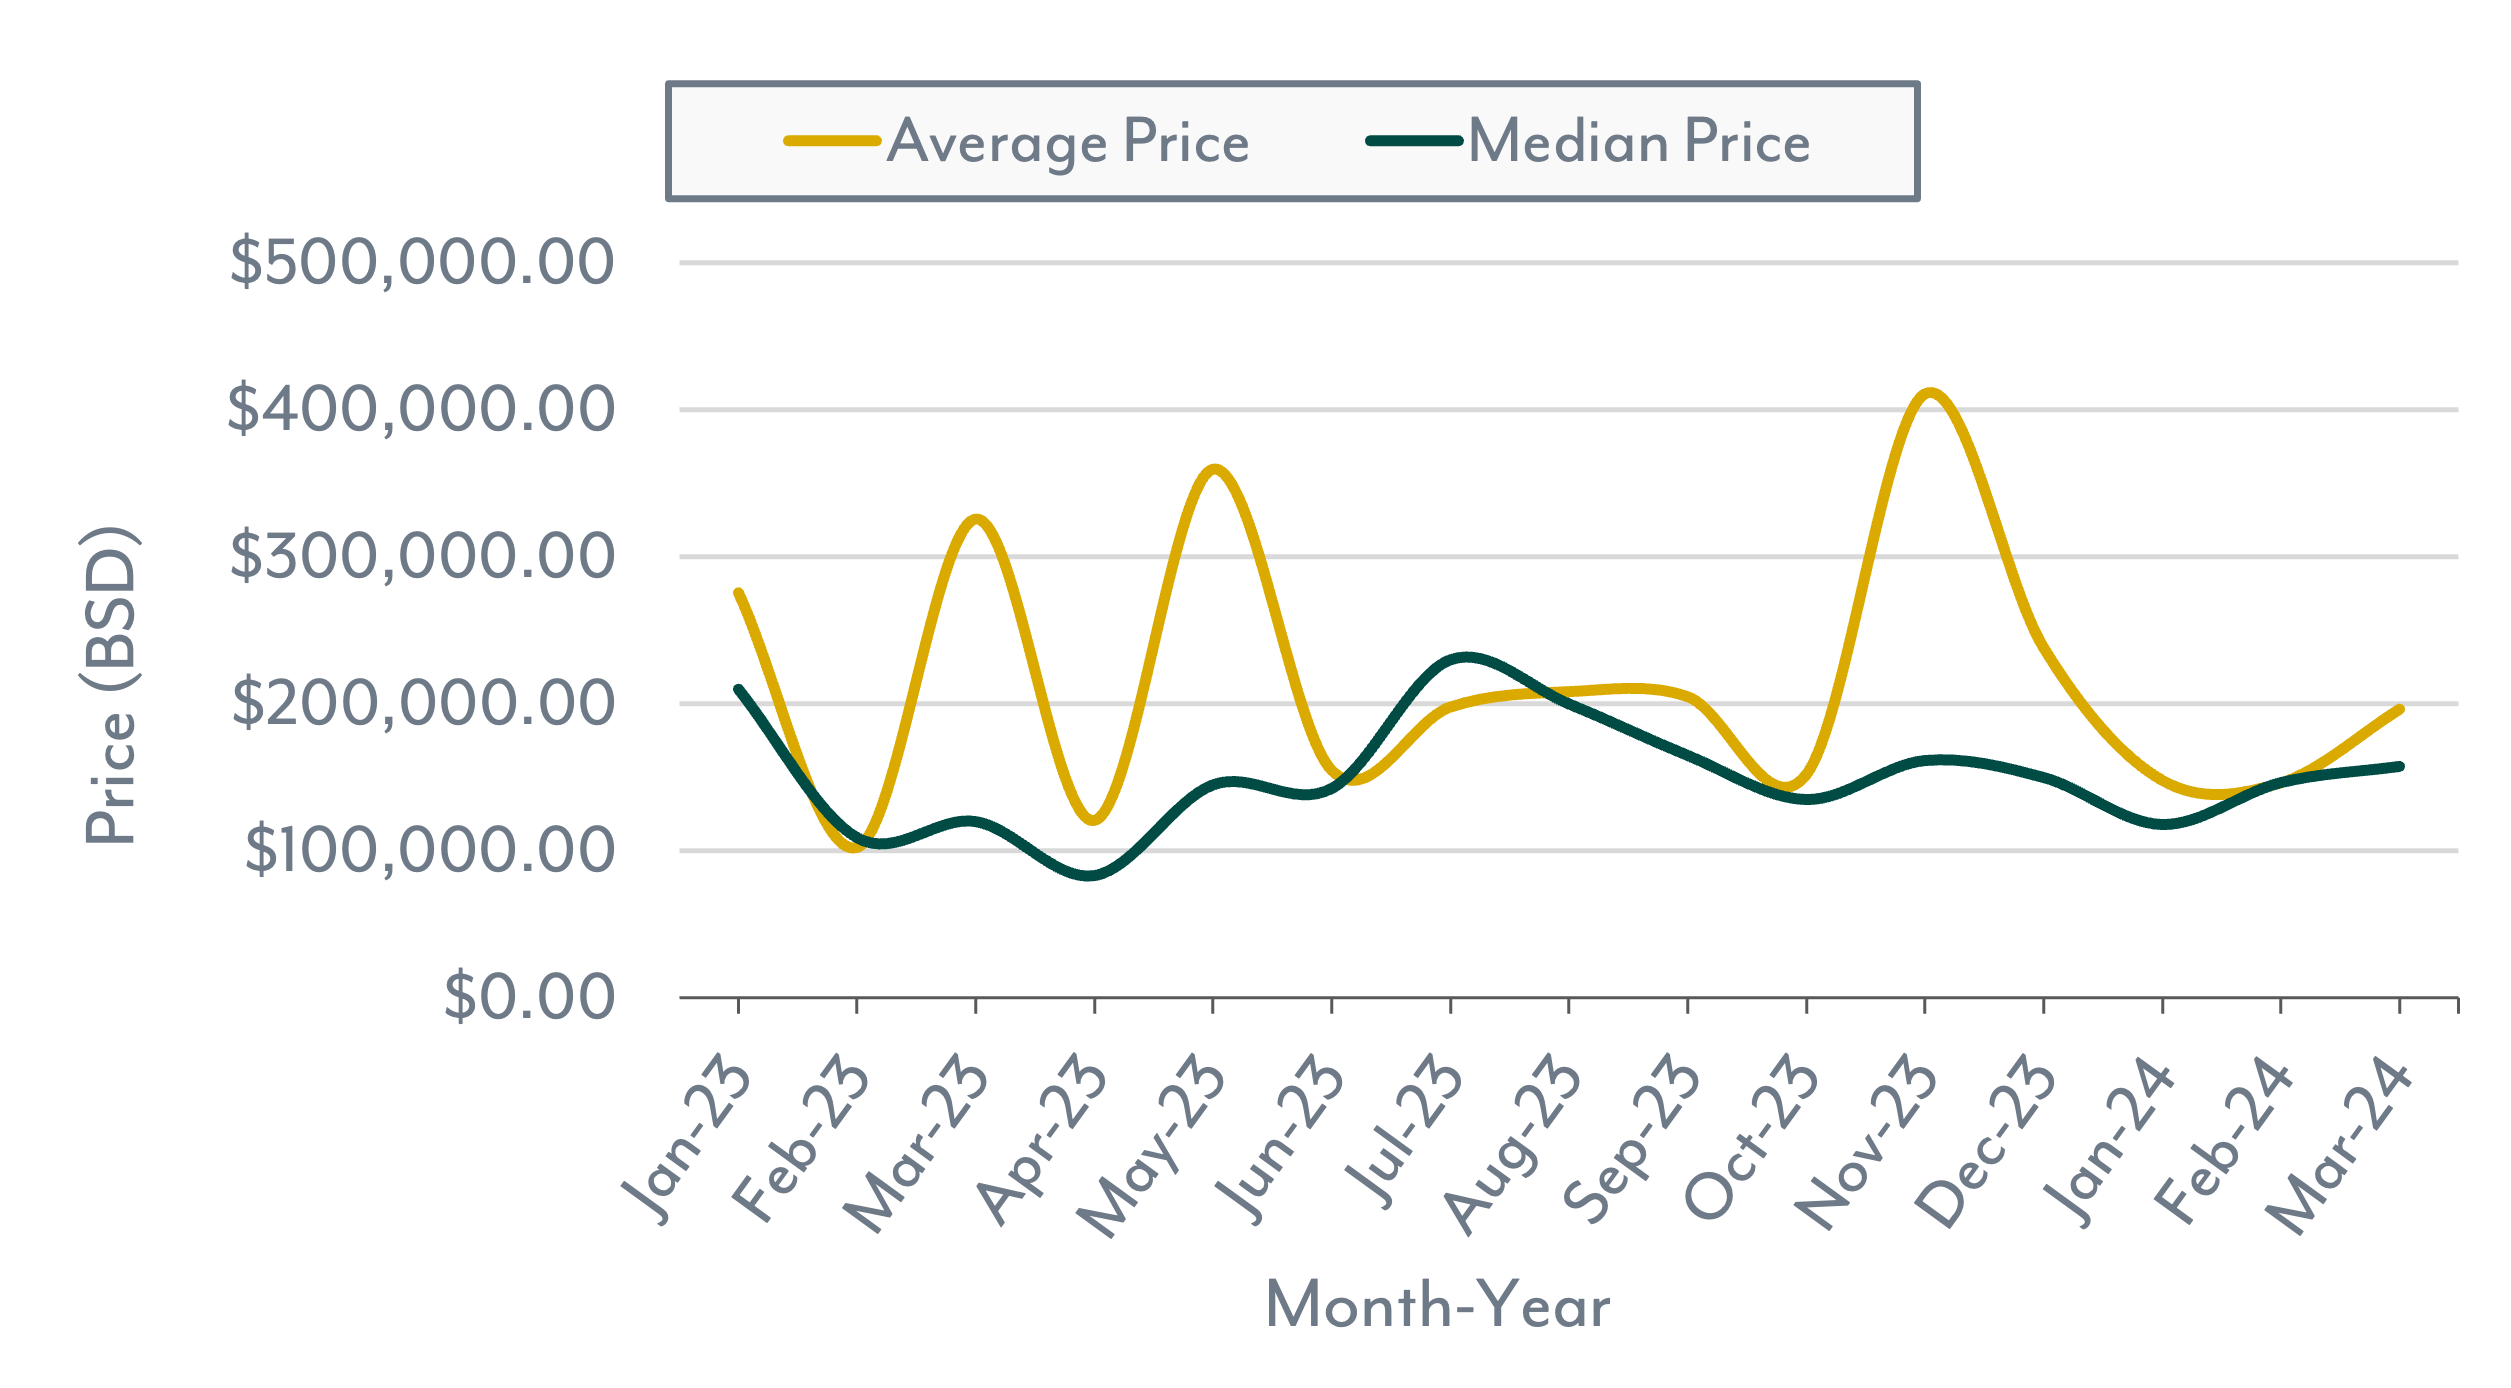
The Median Price for land appears to be stabilizing around the $150,000 mark. While there has been a notable 31.3% increase from March 2023 to March 2024, this translates to a difference of $30,000, typical of month-to-month fluctuations. On the other hand, the Average Price of land sales during the first quarter of 2024 has remained relatively steady. However, March 2024 Average Price witnessed a considerable 39.7% decrease compared to March 2023, and the year-to-date comparison indicates a 31.9% Average Price drop in 2024 compared to 2023.
In March 2024, the Median Days on the Market (DOM) saw a significant uptick of 220.7% from March 2023. To assess the legitimacy of these increases, year-to-date comparisons for the first quarters of 2023 and 2024 reveal an overall 70.5% increase.
The Average List/Sale Ratio (price) has remained relatively stable, aligning with ratios observed over the past two years. Although there's been a slight upward trend in the past three months, this ratio remains within the middle range of the market. March 2024 shows a marginal 3.9% increase compared to March 2023, while year-to-date comparisons indicate a similar decrease of 3.9%.
Land Market Indicators
New Listings, Contracted Sales & Completed Sales
Average & Median Price
Curious about whatyour home or property is worth now?
We're able to explain what these numbers mean for you and your home's or property's current market value.