
Our monthly Market Report provides meaningful and valuable information, to empower buyers and sellers who are considering a real estate transaction in Nassau or Paradise Island (Bahamas).
If you're considering selling your property or buying property on Nassau or Paradise Island, it's essential to understand what's happening in The Bahamas' real estate market. Knowing the most important data, such as median and average prices, the number of properties sold, the number of new listings, and the days on the market will better prepare you for selling or buying.
We are happy to share our April 2025 analysis of the Nassau and Paradise Island market. We also encourage you to review our quarterly market reports on Abaco, Eleuthera, Exuma, Grand Bahama and New Providence.
Our market reports provide Morley's interpretation of the data from the Bahamas Real Estate Association MLS. Even though the MLS does not include all real estate sales and related real estate data, we believe the MLS data is reasonable and consistent to be reliable to use to estimate local real estate trends.

The Nassau & Paradise Island housing market in April 2025 showed signs of a tightening supply, steady buyer engagement, and evolving price behavior.
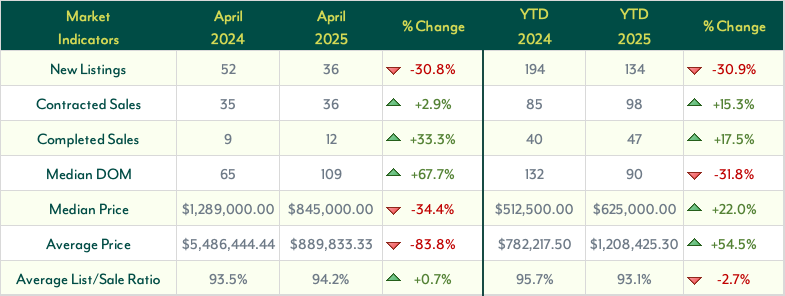
New Listings dropped 30.8% year-over-year (YoY) to just 36 properties, a clear signal that fewer New Listings are hitting the market. Year-to-date (YTD), new listings are down 30.9%, marking a sustained trend of sellers holding back or fewer properties coming to market.
Contracted Sales rose slightly by 2.9% YoY, reaching 36 properties under contract. This small increase, coupled with a 15.3% YTD gain (98 contracts vs. 85 last year), shows resilient buyer demand despite fewer new homes on the market.
Completed Sales improved by 33.3% YoY, with 12 homes closing in April. On a broader scale, YTD completed sales rose 17.5%, totaling 47 closings so far in 2025—evidence that deals are continuing to reach the finish line.
There was a noticeable change in Median Days on Market (DOM), which rose 67.7% YoY to 109 days. This indicates that properties are taking longer to sell compared to the same time last year. However, the YTD DOM dropped 31.8%, settling at 90 days, which suggests that over the long term, the pace of sales is still ahead of last year.
Price trends were mixed. The Median Price fell 34.4% YoY to $845,000, and the Average Price dropped sharply by 83.8% to $889,833, likely due to fewer luxury property sales. Still, YTD median and average prices rose 22.0% and 54.5%, respectively, showing long-term appreciation.
The Average List-to-Sale Price Ratio increased 0.7% YoY to 94.2%, but the YTD figure fell 2.7%, suggesting slightly more negotiation room.
Overall, April reflected a shifting yet active market, where lower inventory and selective pricing are shaping buyer and seller behavior.
Home Market Indicators
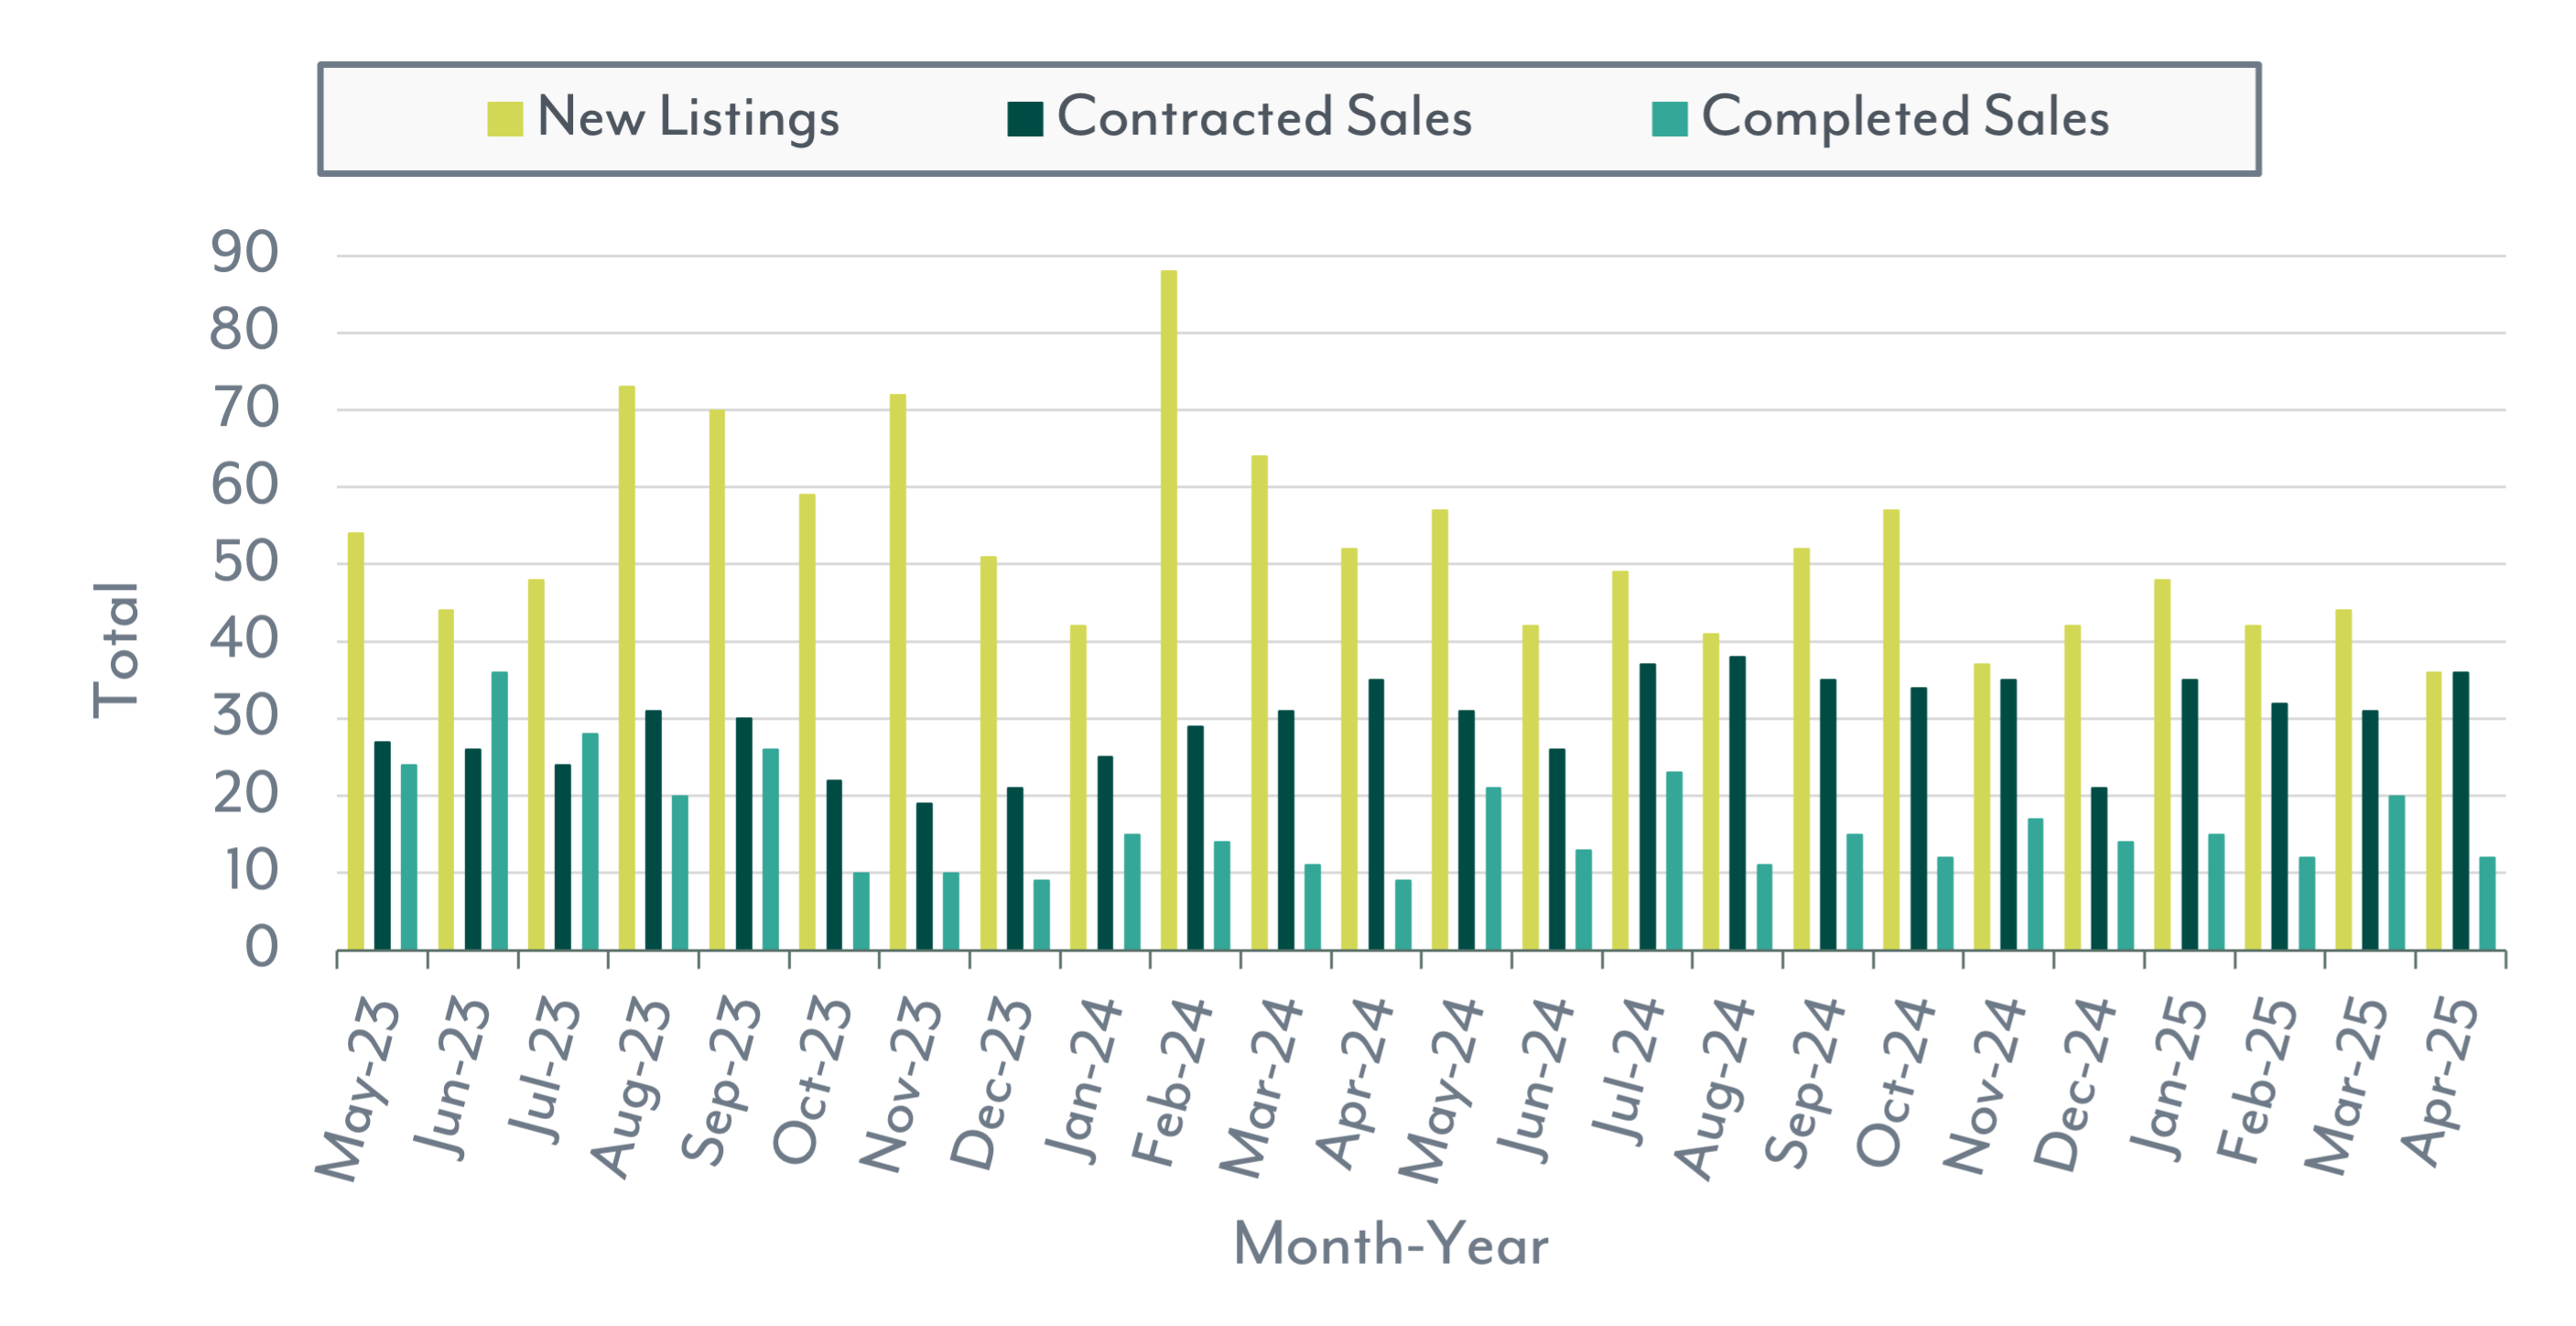
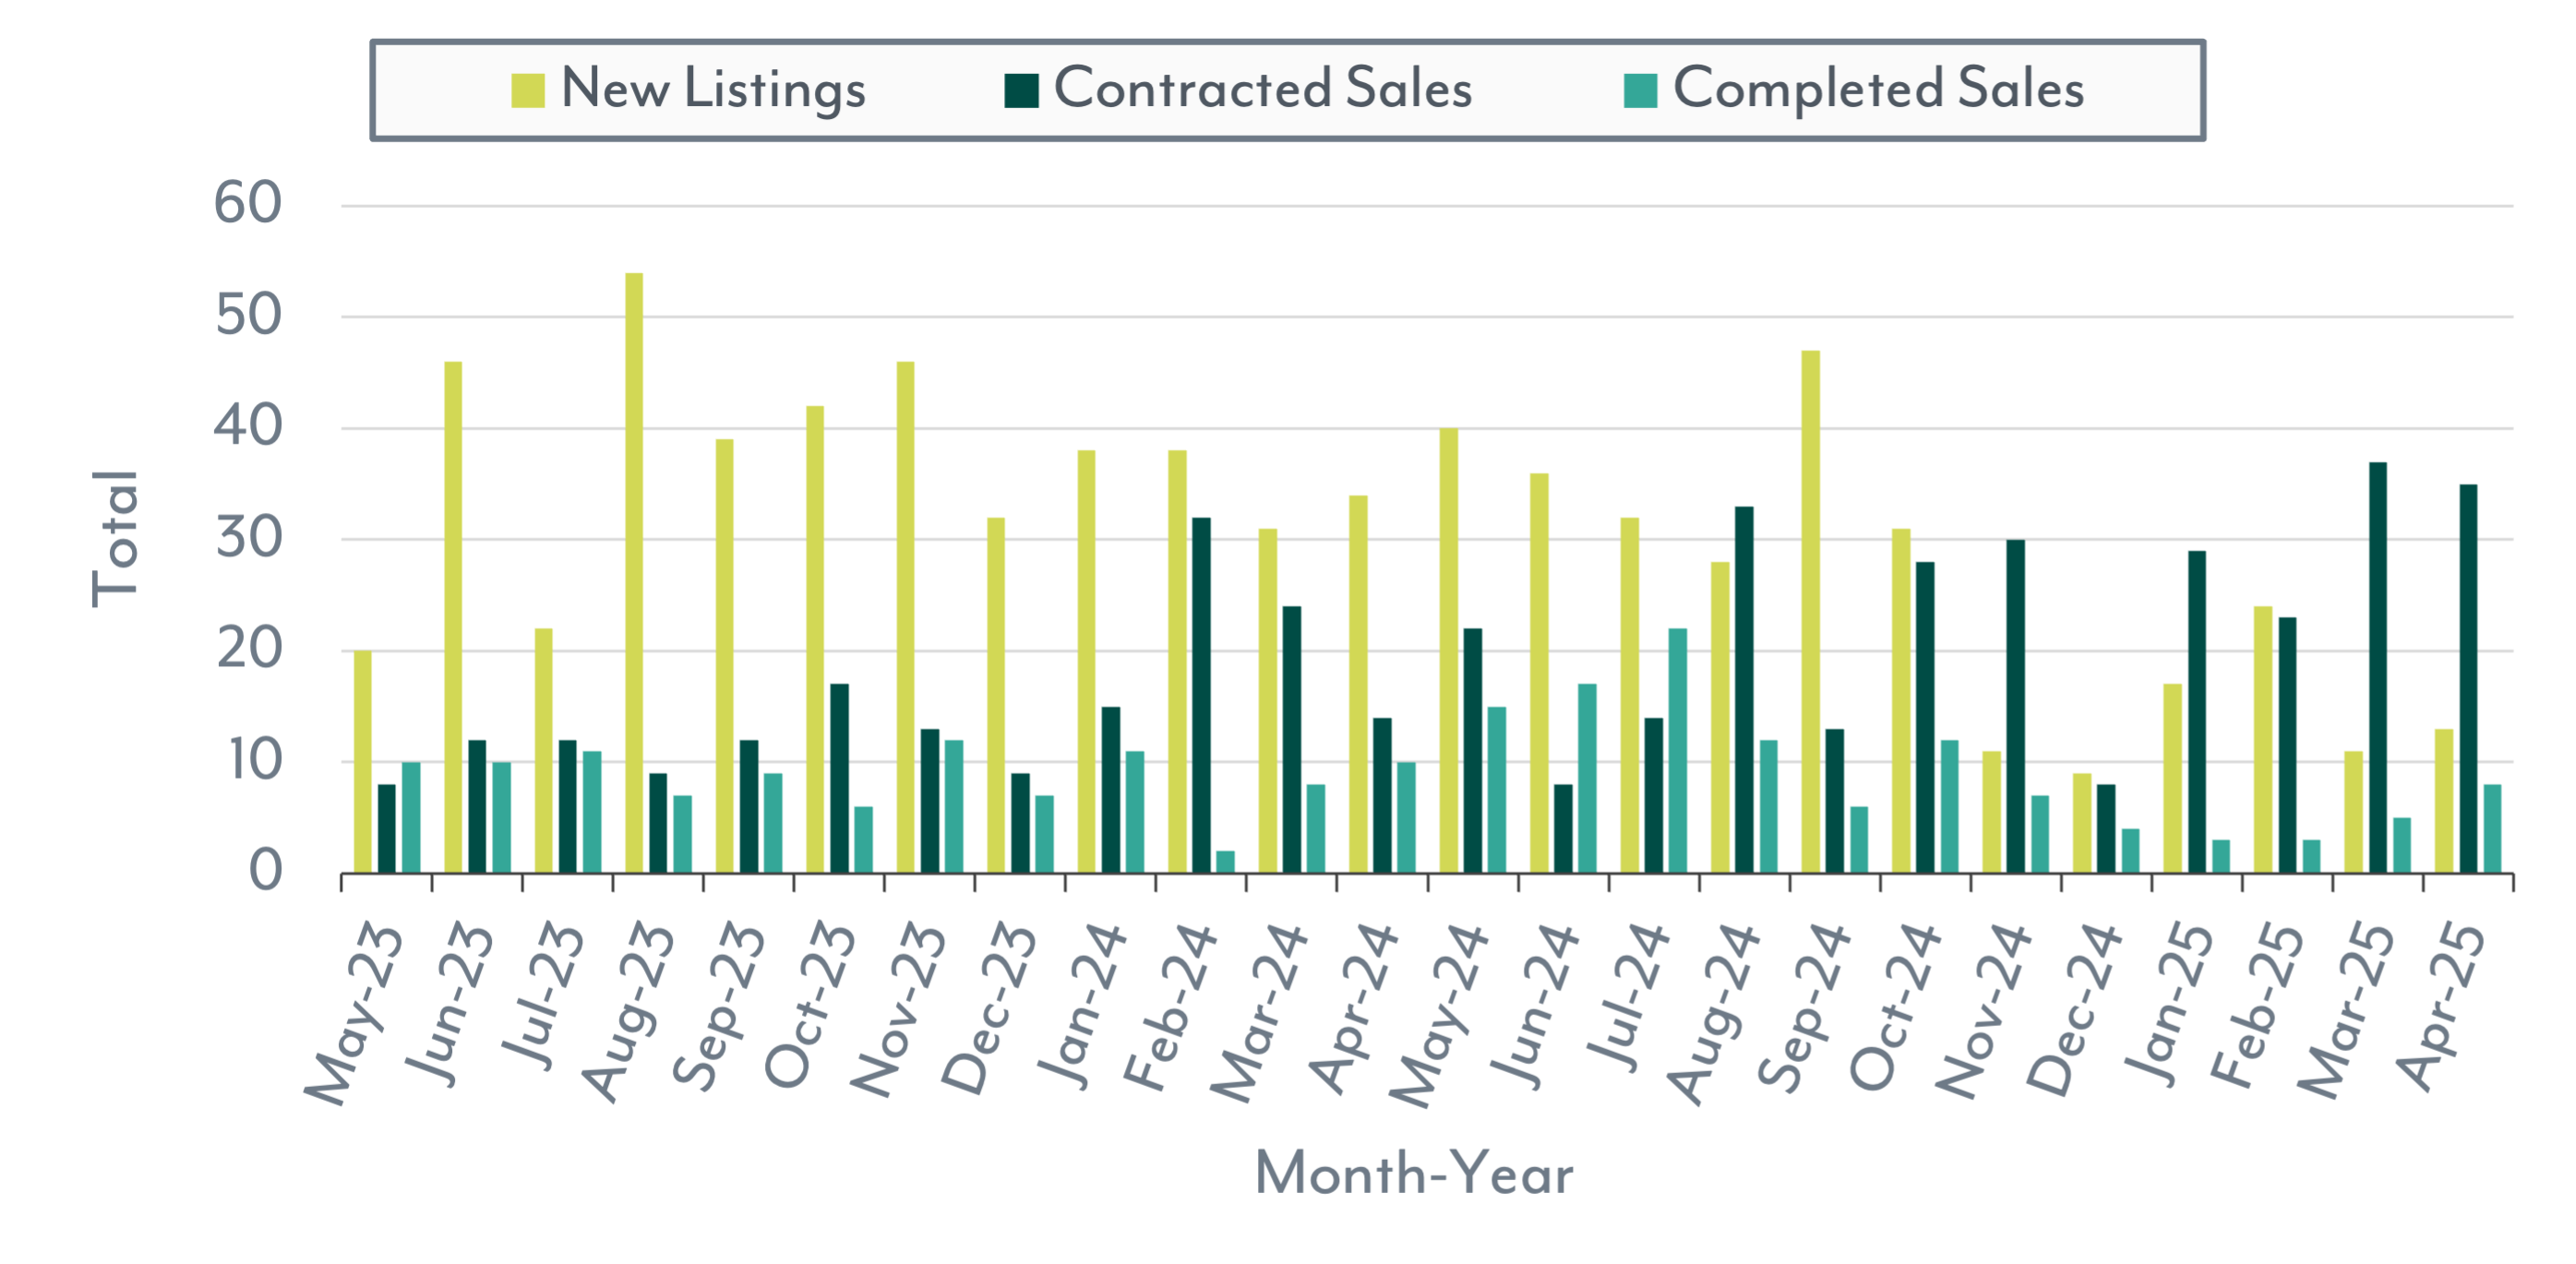
New Listings, Contracted Sales & Completed Sales
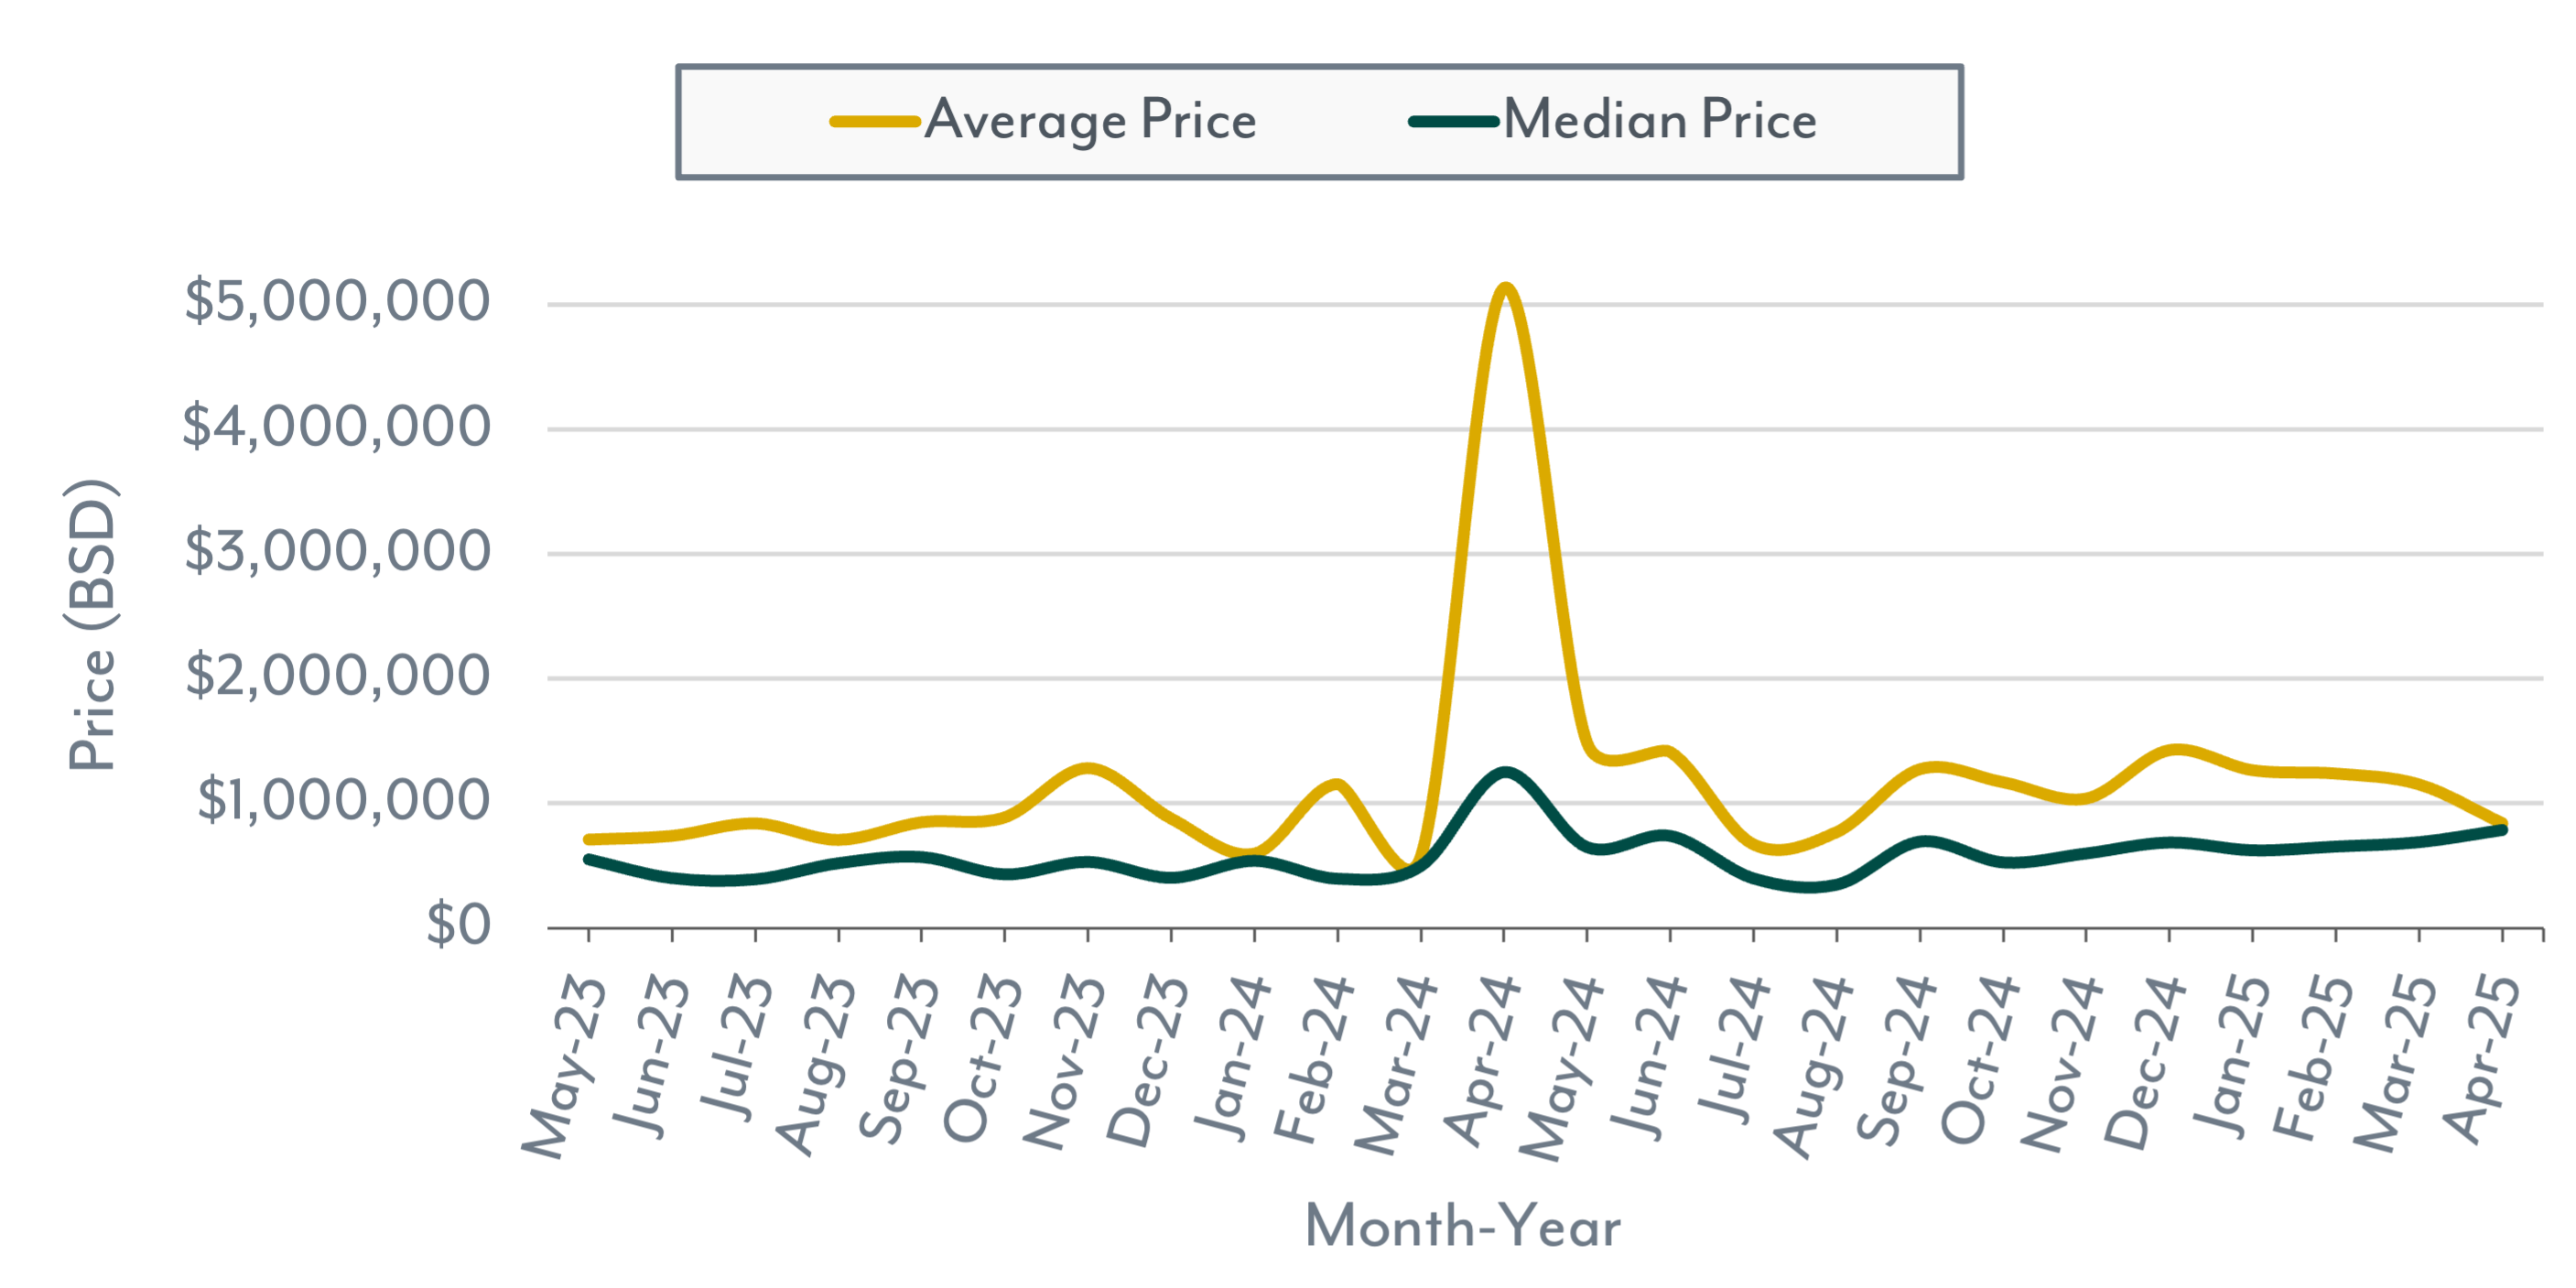
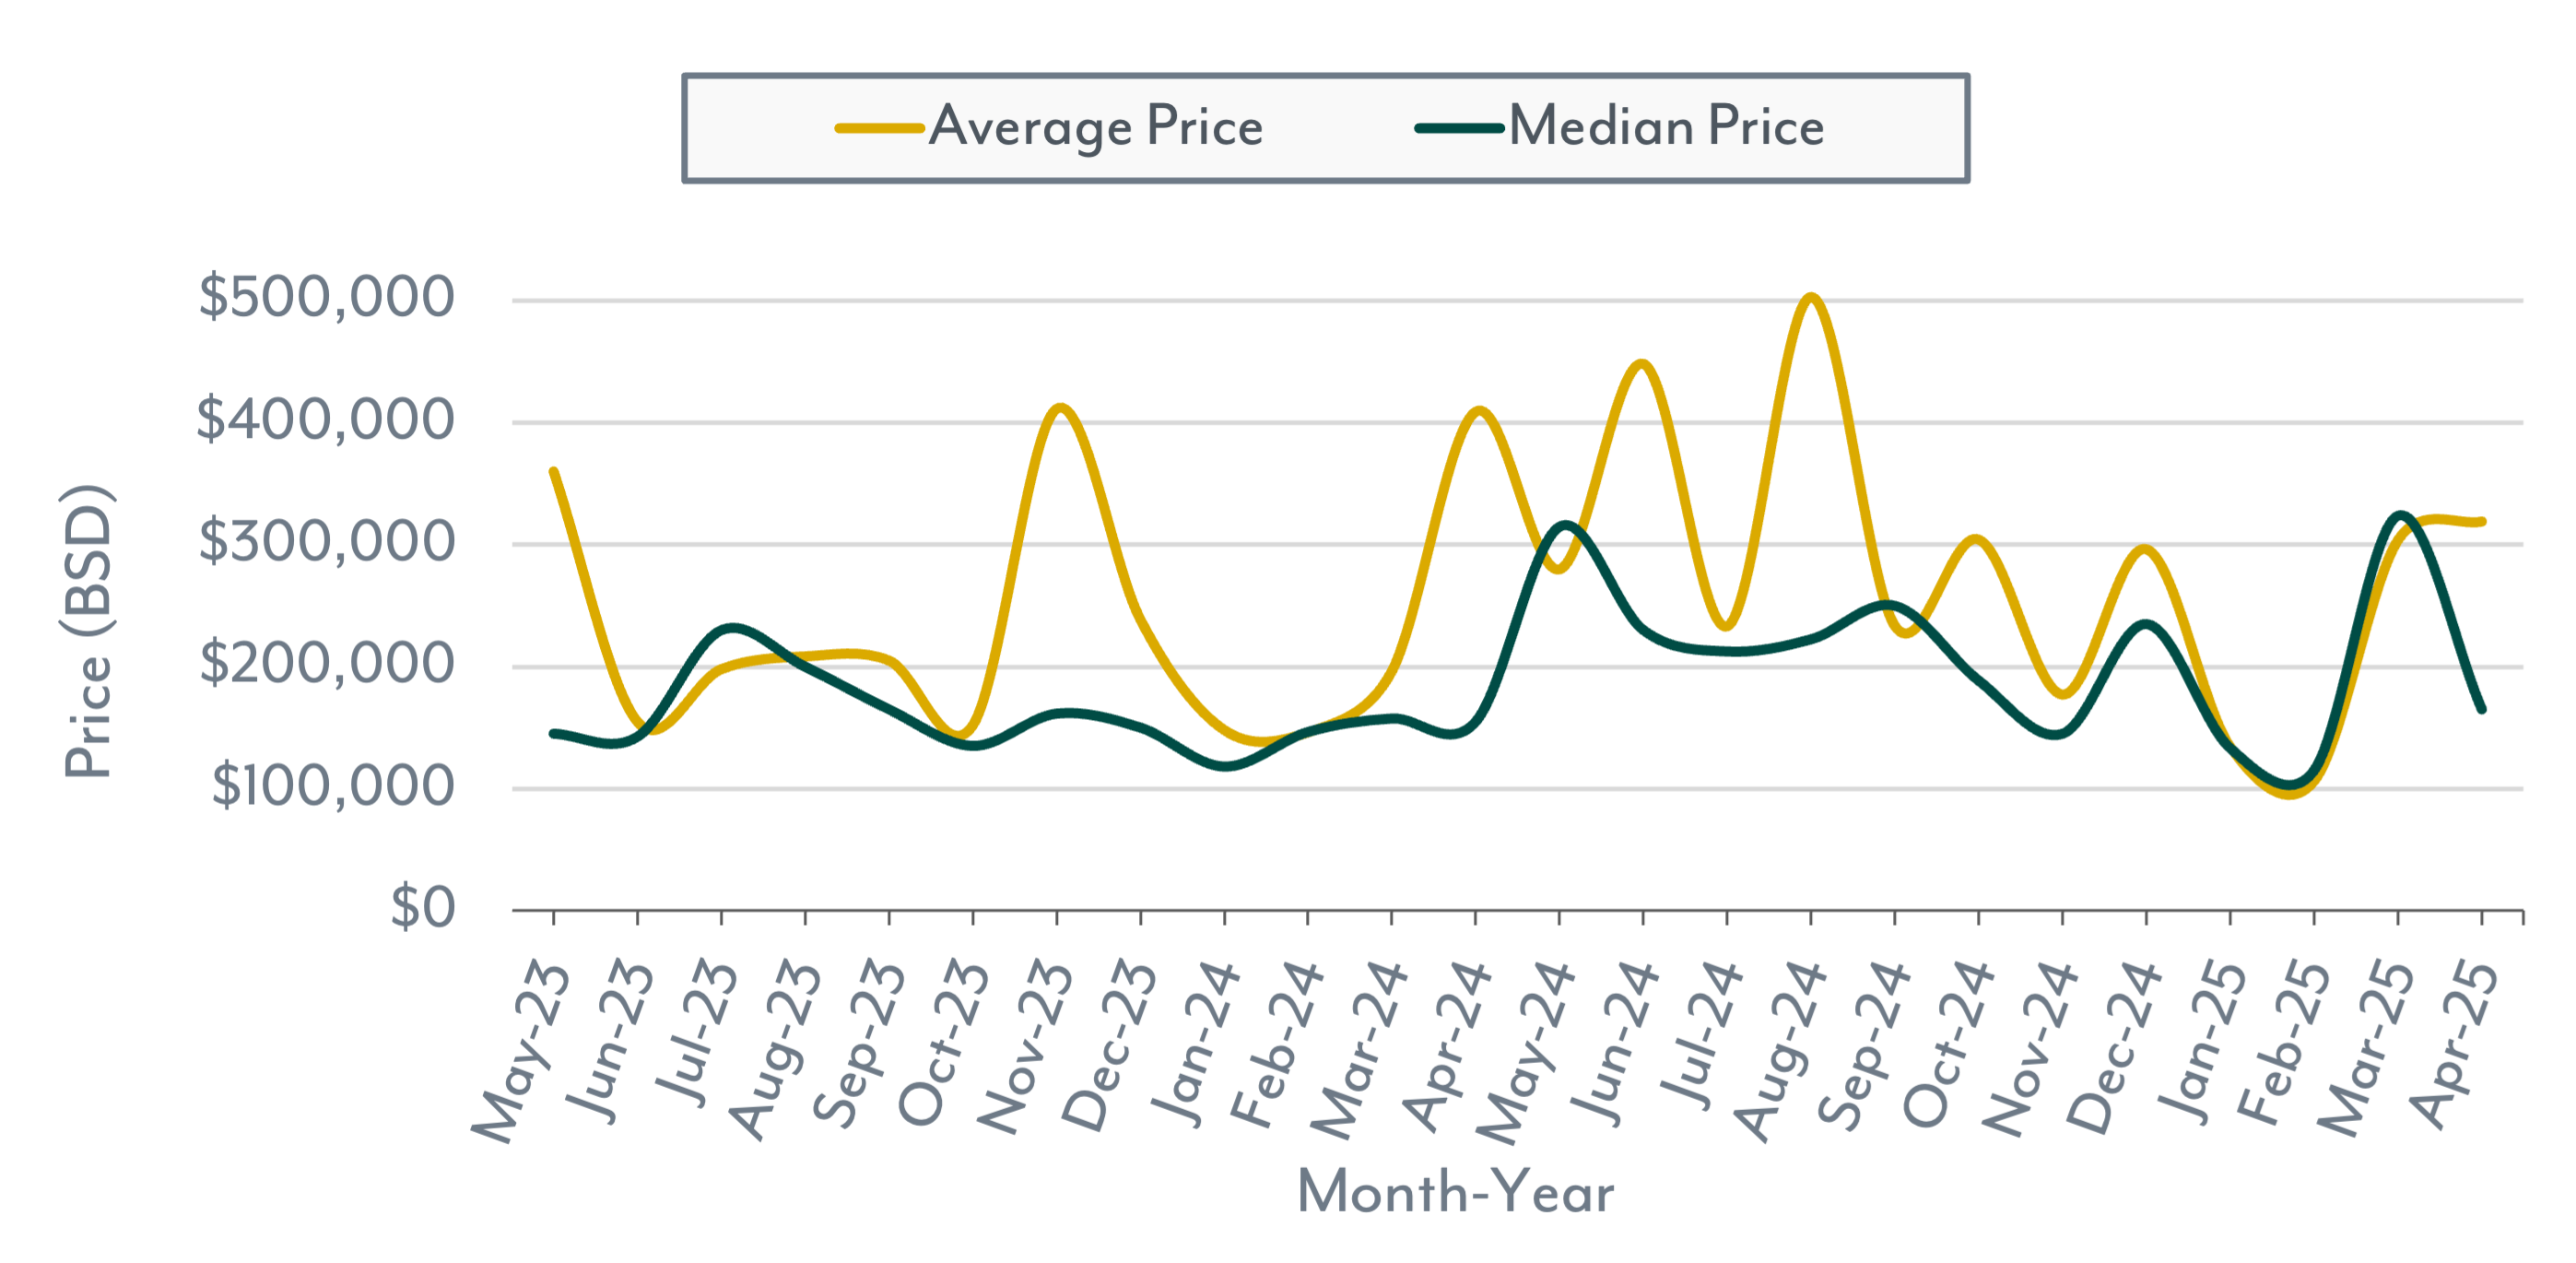
Average & Median Price

The Nassau and Paradise Island land market in April 2025 continued to reflect reduced supply, rising buyer activity, and shifting price dynamics.
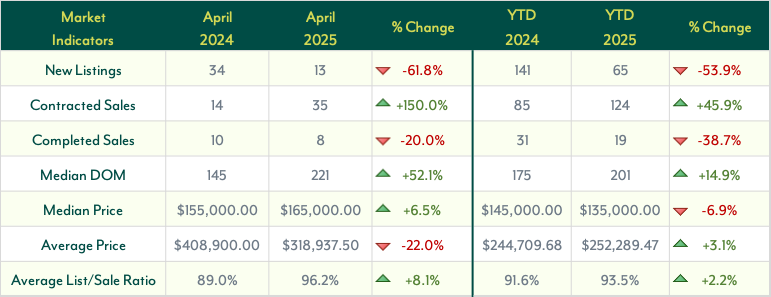
New Listings dropped significantly to just 13, a 61.8% decline from April 2024. This significant year-over-year (YoY) drop, combined with a 53.9% decrease in listings year-to-date (YTD), highlights decreasing availability of land parcels. Many sellers may be holding off, leading to lower inventory.
Contracted Sales, however, rose sharply by 150.0% YoY, reaching 35 in April. This momentum carried into the YTD totals as well, which showed a 45.9% increase, rising from 85 to 124. The continued growth in pending sales points to steady buyer demand, even amid lower supply.
In contrast, Completed Sales declined to 8, marking a 20.0% decrease YoY. The YTD drop was even steeper at 38.7%, falling from 31 to 19, suggesting a lag between contract signings and closings—potentially due to extended due diligence periods or financing hurdles.
The Median Days on Market (DOM) increased by 52.1% YoY, from 145 to 221 days, indicating slower deal completion for houses sold during April 2025. YTD, DOM also rose by 14.9%, reinforcing the trend toward longer sales cycles.
Pricing remained mixed. The Median Price increased 6.5% YoY to $165,000, but YTD it declined 6.9% to $135,000, suggesting some variability month to month. Meanwhile, the Average Price dropped 22.0% YoY to $318,938, though YTD it was up 3.1%, reflecting a resilient mid-range market.
Sellers fared slightly better in negotiations, as the Average List/Sale Ratio rose to 96.2%, an 8.1% YoY increase. The YTD figure also jumped up by 2.2%, to 93.5%.
Overall, April’s land market showed robust buyer interest but constrained supply, slower closings, and evolving price trends.
Land Market Indicators
New Listings, Contracted Sales & Completed Sales
Average & Median Price
Not sure if you are ready to buy or sell?
We're able to explain what these numbers mean for you and better guide you to make an informed decision that is best for you based on the current market conditions.